


F1 to F-beta
Last Updated on October 10, 2022 by Editorial Team
Author(s): Saurabh Saxena
Originally published on Towards AI the World’s Leading AI and Technology News and Media Company. If you are building an AI-related product or service, we invite you to consider becoming an AI sponsor. At Towards AI, we help scale AI and technology startups. Let us help you unleash your technology to the masses.
Model Evaluation
F1 Score
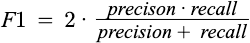
The F-1 score is a popular binary classification metric representing a balance between precision and recall. It is the Harmonic mean of precision and recall. The following equation can represent the F-1 score.
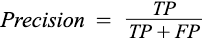
where Precision can be defined as the probability of positive predictions that are actual members of the positive class.
The recall is defined as the probability of the positive predictions among the actual positive.
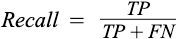
where TP is True Positive, FP is False Positive, and FN is the False Negative.
Let’s explore the F1 score for the binary classification problems with a dummy dataset in sklearn.
from sklearn.datasets import make_classification
from sklearn.model_selection import train_test_split
from sklearn.linear_model import LogisticRegression
from sklearn.metrics import f1_score
X, y = make_classification(n_samples=1000, n_classes=2,
                           random_state=1)
X_train, X_test, y_train, y_test = train_test_split(X, y,
                                                    test_size=.2,
                                                    random_state=2)
lr = LogisticRegression()
lr.fit(X_train, y_train)
y_pred = lr.predict(X_test)
y_pred_prob = lr.predict_proba(X_test)
y_pred_prob = y_pred_prob[:,1]
f1_score(y_test, y_pred)
Output:
0.8585858585858585
While many Machine Learning and Deep Learning practitioners frequently use the F1 score for model evaluation, few are familiar with the F-measure, which is the general form of the F1 Score.
F-beta Score
The F-beta score calculation follows the same form as the F1 score. Unlike in F1 Score, which is the harmonic mean, it is the weighted harmonic mean of the precision and recall, reaching its optimal value at 1 and worst value at 0.
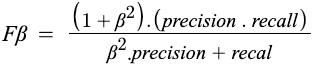
The beta parameter determines the weight of recall in the combined score. beta < 1 lends more weight to precision while beta > 1 favors recall.
Let’s have a look at the F-beta score and how the value fluctuates with beta.
from sklearn.metrics import fbeta_score
print(fbeta_score(y_test, y_pred, beta=0.5))
print(fbeta_score(y_test, y_pred, beta=1))
print(fbeta_score(y_test, y_pred, beta=2))
Output:
0.853413654618474
0.8585858585858585
0.8638211382113821
Here, we have noticed that F-beta changes with beta movement, and now let’s have a look at the same relative to precision and recall curve at various thresholds.
import matplotlib.pyplot as plt
from sklearn.metrics import recall_score
from sklearn.metrics import precision_score
from sklearn.metrics import precision_recall_curve
_, _, threshold = precision_recall_curve(y_test, y_pred_prob)
f1score = list()
f05score = list()
f2score = list()
precision = list()
recall = list()
for th in threshold:
    y_test_pred = list()
    for prob in y_pred_prob:
        if prob > th:
            y_test_pred.append(1)
        else:
            y_test_pred.append(0)

    f1score.append(f1_score(y_test, y_test_pred))
    precision.append(precision_score(y_test, y_test_pred))
    recall.append(recall_score(y_test, y_test_pred))
    f05score.append(fbeta_score(y_test, y_test_pred, beta=0.5))
    f2score.append(fbeta_score(y_test, y_test_pred, beta=2))
_, ax = plt.subplots(figsize=(8, 6))
ax.set_xlabel('Threshold')
plt.plot(threshold, precision, label='precision')
plt.plot(threshold, recall, label='recall')
plt.plot(threshold, f05score, label='F0.5')
plt.plot(threshold, f1score, label='F1')
plt.plot(threshold, f2score, label='F2')
plt.legend(loc='lower left')
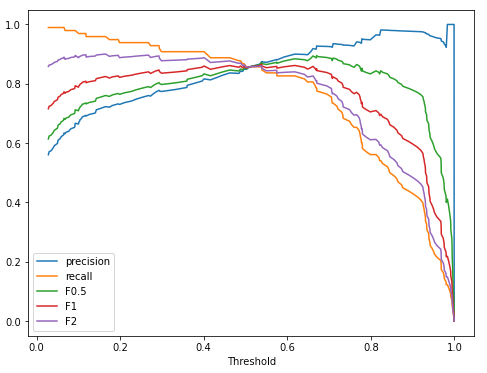
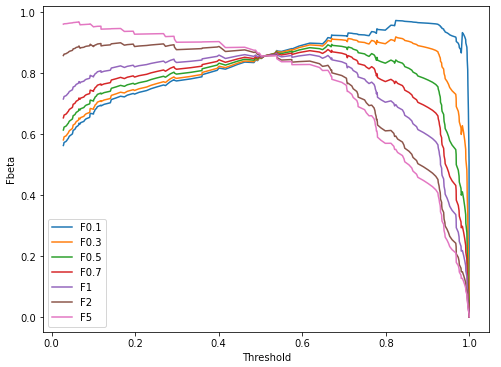
It is evident in the above graph that as we increase our beta value from 0, the curve starts moving towards the recall curve, which means with an increase in the beta value gives more importance to recall, and the below code to plot the F-measure at various beta and threshold values.
betas = [0.1, 0.3, 0.5, 0.7, 1, 2, 5]
_, ax = plt.subplots(figsize=(8, 6))
ax.set_xlabel('Threshold')
ax.set_ylabel('Fbeta')
for beta in betas:
    fbetascore = list()
    for i, th in enumerate(threshold):
        y_test_pred = list()
        for prob in y_pred_prob:
            if prob > th:
                y_test_pred.append(1)
            else:
                y_test_pred.append(0)
        fbetascore.append(fbeta_score(y_test, y_test_pred,
                                      beta=beta))
    plt.plot(threshold, fbetascore, label=f'F{beta}')
plt.legend(loc='lower left')
References:
[1] F1 Score. https://scikit-learn.org/stable/modules/generated/sklearn.metrics.f1_score.html#sklearn.metrics.f1_score
[2] Fbeta Score. https://scikit-learn.org/stable/modules/generated/sklearn.metrics.fbeta_score.html
F1 to F-beta was originally published in Towards AI on Medium, where people are continuing the conversation by highlighting and responding to this story.
Join thousands of data leaders on the AI newsletter. It’s free, we don’t spam, and we never share your email address. Keep up to date with the latest work in AI. From research to projects and ideas. If you are building an AI startup, an AI-related product, or a service, we invite you to consider becoming a sponsor.
Published via Towards AI
Towards AI Academy
We Build Enterprise-Grade AI. We'll Teach You to Master It Too.
15 engineers. 100,000+ students. Towards AI Academy teaches what actually survives production.
Start free — no commitment:
→ 6-Day Agentic AI Engineering Email Guide — one practical lesson per day
→ Agents Architecture Cheatsheet — 3 years of architecture decisions in 6 pages
Our courses:
→ AI Engineering Certification — 90+ lessons from project selection to deployed product. The most comprehensive practical LLM course out there.
→ Agent Engineering Course — Hands on with production agent architectures, memory, routing, and eval frameworks — built from real enterprise engagements.
→ AI for Work — Understand, evaluate, and apply AI for complex work tasks.
Note: Article content contains the views of the contributing authors and not Towards AI.
Related posts
Recent Posts


")

