


Ecommerce Data Analysis for Sales Strategy Using Python
Last Updated on March 24, 2021 by Editorial Team
Author(s): Juhi Sharma
Data Analysis
E-commerce Data Analysis for Sales Strategy Using Python
K-mart sales strategy for the year 2020 based on the insights from the sales data in 2019.
Introduction
Kmart is a leading online retailer in the US and as part of their annual sales review meeting, they need to decide on their sales strategy for the year 2020 based on the insights from the sales data in 2019.
Data is related to sales for each month of 2019 and the task is to generate key insights which will help the sales team of Kmart to take some key business decisions towards Fine-tuning their sales strategy.
Data Understanding
1.Data Belongs to Kmart -a leading online retailer in the US.
2.Time Period — January 2019 — December 2019
3.Unique Product — 19
4.Total Orders — 178437
5.Cities — 9
6.KPI’s — Total Sales, Total Products Sold
Business Problem Statements
1.What was the best month for sales? How much was earned that month?
2.Which city had the highest number of sales?
3.Recommend the most appropriate time to display advertising to maximize the likelihood of customers buying the products?
4.What products sold the most? Why do you think it sold the most?
Data Analysis Using Python
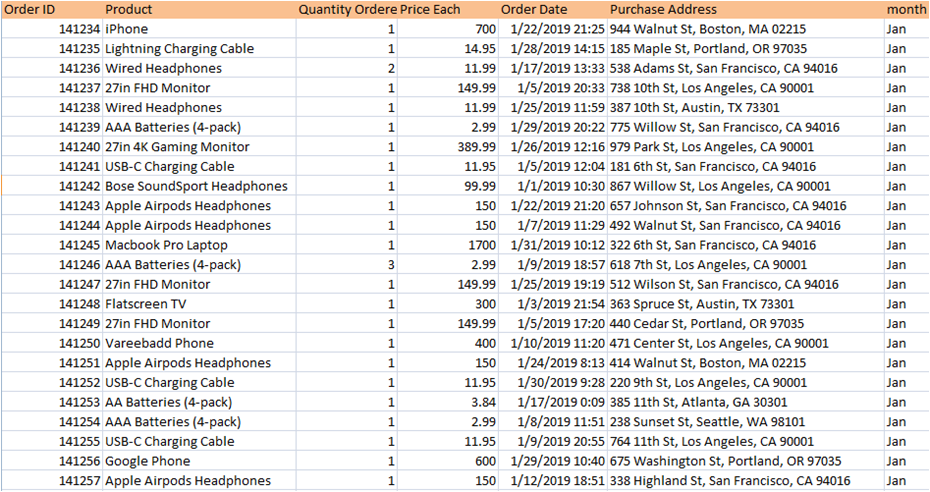
1.Loaded Data of each month and made data frame using pandas
2.Concatenated Dataset to make one Dataset for 2019 sales.
3.Treating Null Values and Junk Data.
4.Made a Filtered Dataset after preprocessing data
5.Analysis and answers to business problems. (visualizations using matplot and seaborn library)
1.Importing Libraries
import pandas as pd
2.Loading Dataset and making Dataframes
df1=pd.read_csv("Sales_January_2019.csv")
df1["month"]="Jan"
df2=pd.read_csv("Sales_February_2019.csv")
df2["month"]="feb"
df3=pd.read_csv("Sales_March_2019.csv")
df3["month"]="mar"
df4=pd.read_csv("Sales_April_2019.csv")
df4["month"]="apr"
df5=pd.read_csv("Sales_May_2019.csv")
df5["month"]="may"
df6=pd.read_csv("Sales_June_2019.csv")
df6["month"]="june"
df7=pd.read_csv("Sales_July_2019.csv")
df7["month"]="july"
df8=pd.read_csv("Sales_August_2019.csv")
df8["month"]="aug"
df9=pd.read_csv("Sales_September_2019.csv")
df9["month"]="sep"
df10=pd.read_csv("Sales_October_2019.csv")
df10["month"]="oct"
df11=pd.read_csv("Sales_November_2019.csv")
df11["month"]="nov"
df12=pd.read_csv("Sales_December_2019.csv")
df12["month"]="dec"
list=[df1,df2,df3,df4,df5,df6,df7,df8,df9,df10,df11,df12]
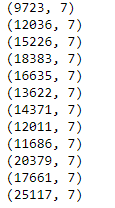
3.The shape of each month’s dataset
for i in list:
    print(i.shape)
4.Concatenating dataset
frame=pd.concat(list)
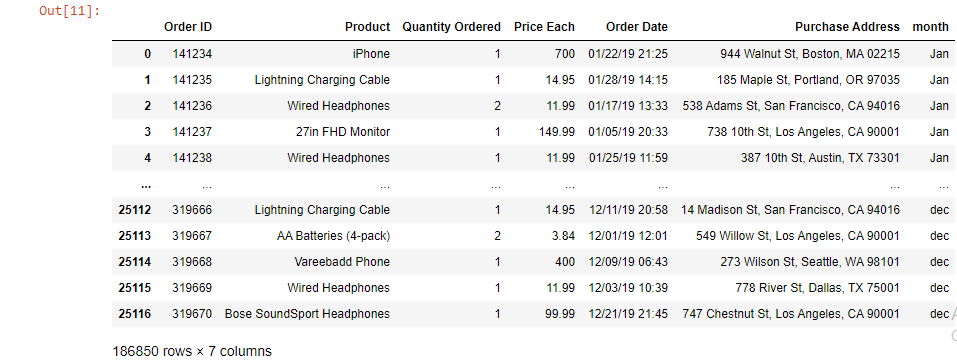
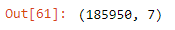
5. Columns of Final Dataset
frame.columns

6. Dataframe Information
frame.info()
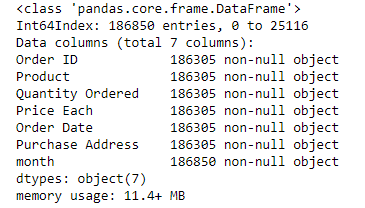
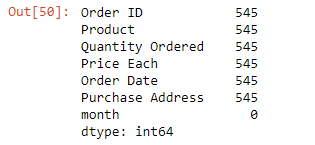
7. Null values in the dataset
frame.isnull().sum() # there are 545 null values in each column except month
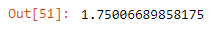
(frame.isnull().sum().sum())/len(frame)*100 # we have 1.75 percent null values , so we can drop them
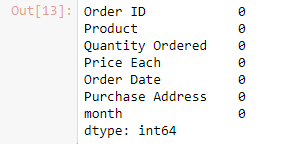
8. Dropping Null Values
frame=frame.dropna()
frame.isnull().sum()
9. Removing Junk Data
we observed that there are 355 columns in which values in rows are the same as the header. so making a new data frame where these values will be excluded.
frame[frame['Quantity Ordered'] == "Quantity Ordered"]
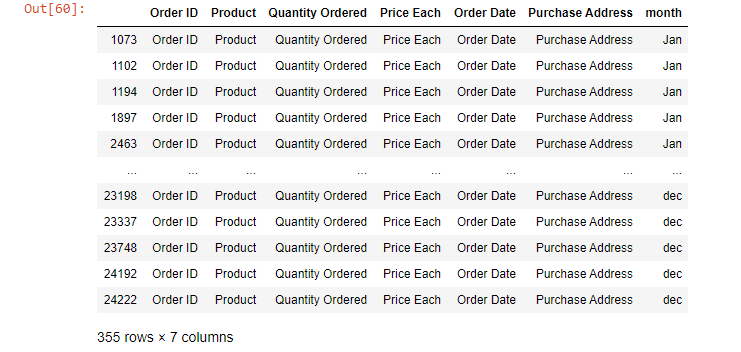
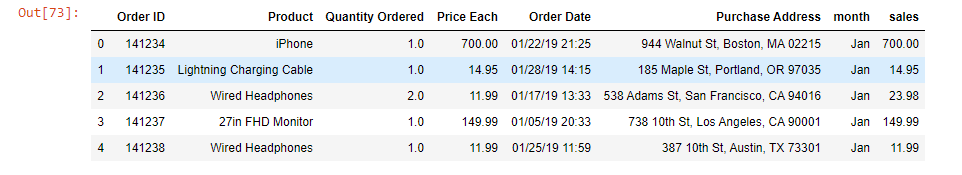
df_filtered = frame[frame['Quantity Ordered'] != "Quantity Ordered"]
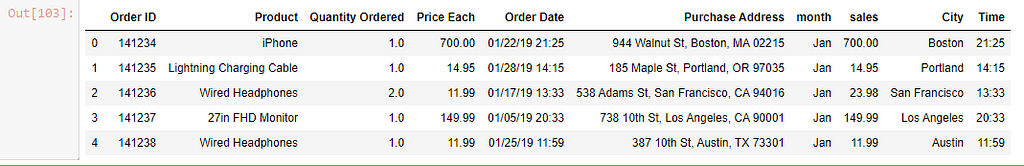
df_filtered.head(15)
df_filtered.shape
Solutions to Business Problems
Qs 1. What was the best month for sales? How much was earned that month?
df_filtered["Quantity Ordered"]=df_filtered["Quantity Ordered"].astype("float")
df_filtered["Price Each"]=df_filtered["Price Each"].astype("float")
# Creating Sales Column By multiplying Quantity Ordered and Price of Each Product
df_filtered["sales"]=df_filtered["Quantity Ordered"]*df_filtered["Price Each"]
month=["dec","oct","apr","nov","may","mar","july","june","aug",'feb',"sep","jan"]
df["month"]=month
from matplotlib import pyplot as plt
a4_dims = (11.7, 8.27)
fig, ax = pyplot.subplots(figsize=a4_dims)
import seaborn as sns
sns.barplot(x = "sales",
            y = "month",
            data = df)
plt.title("Month wise Sale")
plt.show()
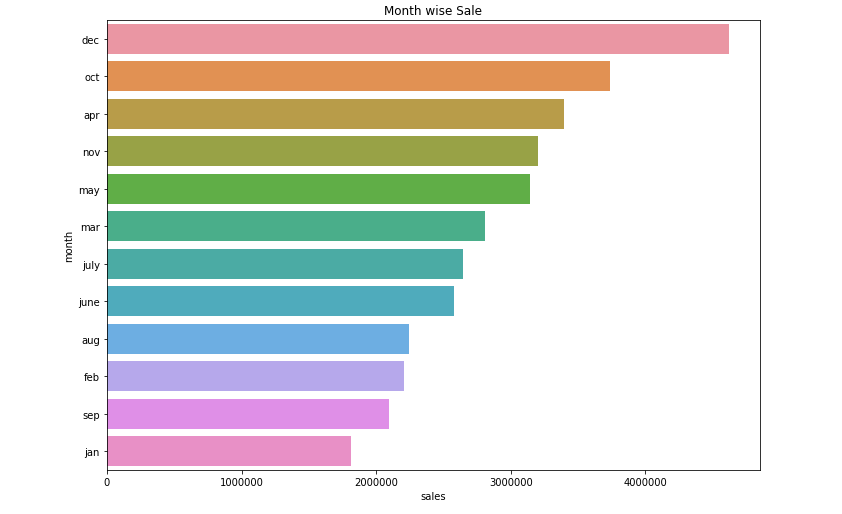
The best Month for sales was DECEMBER
Total sales in December is $ 4619297
Qs 2. Which city had the highest number of sales?
dftemp = df_filtered
list_city = []
for i in dftemp['Purchase Address']:
list_city.append(i.split(",")[1])
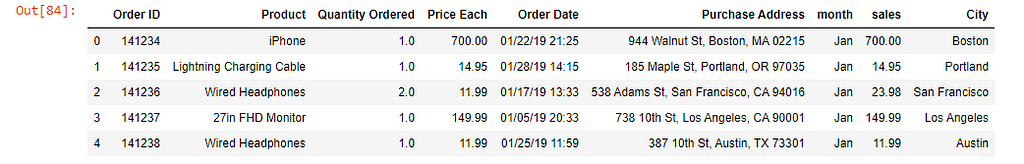
dftemp['City'] = list_city
dftemp.head()
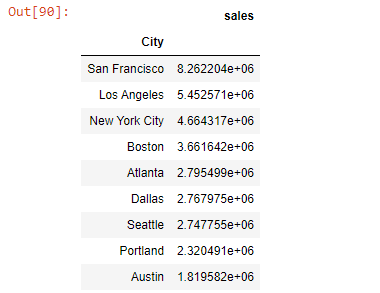
df_city=df_filtered.groupby(["City"])['sales'].sum().sort_values(ascending=False)
df_city=df_city.to_frame()
df_city
city=["San Francisco","Los Angeles","New York City","Boston","Atlanta","Dallas","Seattle","Portland","Austin"]
df_city["city"]=city
from matplotlib import pyplot
a4_dims = (11.7, 8.27)
fig, ax = pyplot.subplots(figsize=a4_dims)
sns.barplot(x = "sales",
            y = "city",
            data = df_city)
plt.title("City wise Sales")
plt.show()
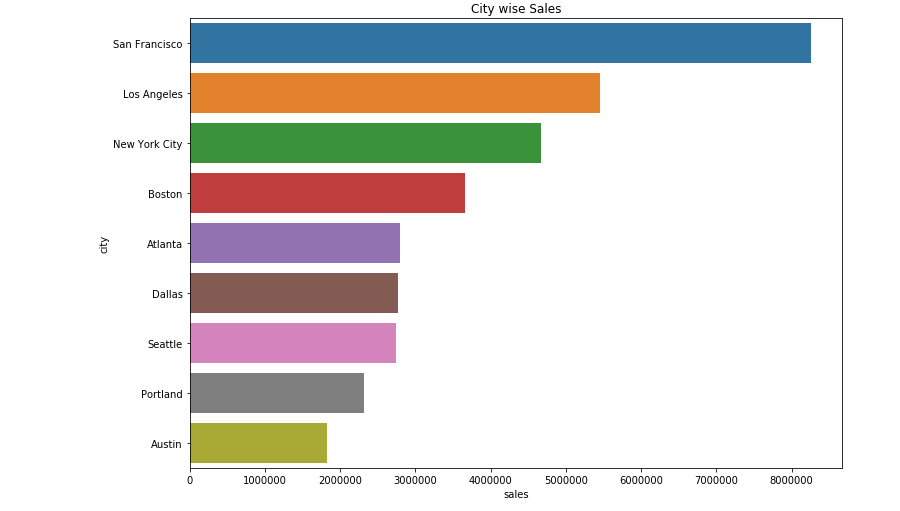
San Francisco has the highest sales f around $8262204.
Qs 3 What products sold the most?
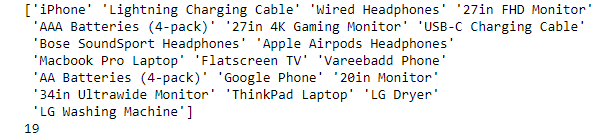
print(df_filtered["Product"].unique())
print(df_filtered["Product"].nunique())
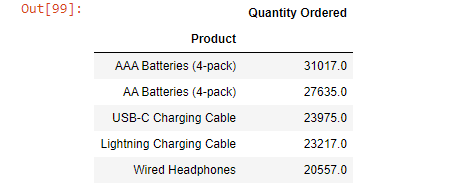
df_p=df_filtered.groupby(['Product'])['Quantity Ordered'].sum().sort_values(ascending=False).head()
df_p=df_p.to_frame()
df_p
product=["AAA Batteries (4-pack)","AA Batteries (4-pack)","USB-C Charging Cable","Lightning Charging Cable","Wired Headphones"]
df_p["Product"]=product
from matplotlib import pyplot
a4_dims = (11.7, 8.27)
fig, ax = pyplot.subplots(figsize=a4_dims)
sns.barplot(x = "Quantity Ordered",
            y = "Product",
            data = df_p)
plt.title("Prouct and Quantity Ordered")
plt.show()
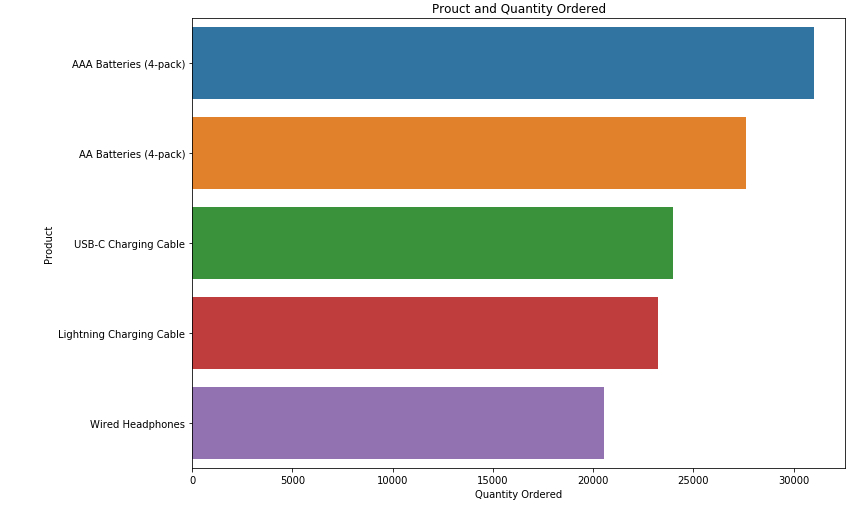
31017.0 quantity of AAA Batteries (4-pack) is sold in a year. It is sold maximum because it is the cheapest product.
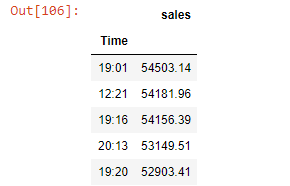
Qs 4 Recommend the most appropriate time to display advertising to maximize the likelihood of customers buying the products?
dftime = df_filtered
list_time = []
for i in dftime['Order Date']:
    list_time.append(i.split(" ")[1])
dftime['Time'] = list_time
dftime.head()
df_t=df_filtered.groupby(['Time'])['sales'].sum().sort_values(ascending=False).head()
df_t=df_t.to_frame()
df_t
df_t.columns

Before You Go
Thanks for reading! If you want to get in touch with me, feel free to reach me at jsc1534@gmail.com or my LinkedIn Profile. Also, you can find the code for this article and some really useful data science projects on my GitHub account.
Ecommerce Data Analysis for Sales Strategy Using Python was originally published in Towards AI on Medium, where people are continuing the conversation by highlighting and responding to this story.
Published via Towards AI
Towards AI Academy
We Build Enterprise-Grade AI. We'll Teach You to Master It Too.
15 engineers. 100,000+ students. Towards AI Academy teaches what actually survives production.
Start free — no commitment:
→ 6-Day Agentic AI Engineering Email Guide — one practical lesson per day
→ Agents Architecture Cheatsheet — 3 years of architecture decisions in 6 pages
Our courses:
→ AI Engineering Certification — 90+ lessons from project selection to deployed product. The most comprehensive practical LLM course out there.
→ Agent Engineering Course — Hands on with production agent architectures, memory, routing, and eval frameworks — built from real enterprise engagements.
→ AI for Work — Understand, evaluate, and apply AI for complex work tasks.
Note: Article content contains the views of the contributing authors and not Towards AI.
Related posts
Recent Posts


")