


Deep dive into Confusion Matrix
Last Updated on January 6, 2023 by Editorial Team
Last Updated on September 26, 2022 by Editorial Team
Author(s): Saurabh Saxena
Originally published on Towards AI the World’s Leading AI and Technology News and Media Company. If you are building an AI-related product or service, we invite you to consider becoming an AI sponsor. At Towards AI, we help scale AI and technology startups. Let us help you unleash your technology to the masses.
Model Evaluation
Deep Dive Into Confusion Matrix
Precision (TPR), Recall (PPV), TNR, FPR, FNR, NPV, F1 Score, Accuracy, Balanced Accuracy, LR+, LR-
In the field of Data Science, model evaluation is the key component of the Training Lifecycle. There are many metrics to evaluate the classification model, but the Accuracy metric is often used. However, Accuracy might not give the correct depiction of the model due to class imbalance, and in such case, the Confusion Matrix is to be used for evaluation.
Confusion Matrix is pivotal to know, as many metrics are derived from it, be it precision, recall, F1-score, or Accuracy.
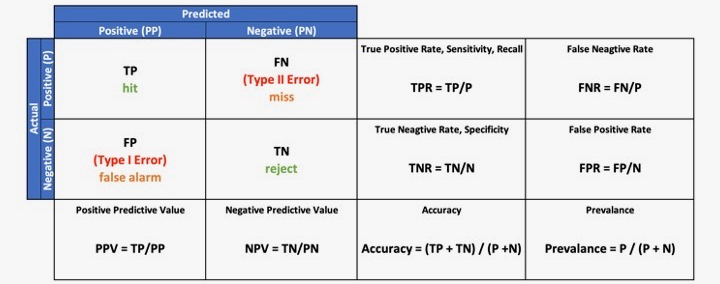
Let’s understand the metrics derived from the Confusion Matrix
True Positive (TP) is the number of correct predictions when the actual class is positive.
True Negative (TN) is the number of correct predictions when the actual class is negative.
False Positive (FP) is the number of incorrect predictions when the actual class is positive, also referred to as Type I Error.
False Negative (FN) is the number of incorrect predictions when the actual class is negative, also referred to as Type II Error.
from sklearn.datasets import load_breast_cancer
from sklearn.model_selection import train_test_split
from sklearn.linear_model import LogisticRegression
from . import confusion_matrix
X, y = load_breast_cancer(return_X_y=True)
X_train, X_test, y_train, y_test = train_test_split(X, y,
                                                    test_size=0.33,
                                                    random_state=42)
lr= LogisticRegression()
lr.fit(X_train,y_train)
y_pred=lr.predict(X_test)
conf_mat = confusion_matrix(y_test, y_pred, plot=False)
TP = conf_mat[0,0]
TN = conf_mat[1,1]
FP = conf_mat[1,0]
FN = conf_mat[0,1]
print("TP: ", TP)
print("TN: ", TN)
print("FP: ", FP)
print("FN: ", FN)
Output:
TP:  63
TN:  118
FP:  3
FN:  4
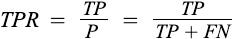
True Positive Rate (TPR), Sensitivity, Recall: It is the probability of a person testing positive who has a disease. In other words, Recall is the proportion of examples of a particular class predicted by the model as belonging to that class.
from sklearn.metrics import recall_score
recall_score(y_test, y_pred)
Output:
0.9752066115702479
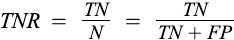
True Positive Rate (TPR), Specificity: It is the probability of a person testing negative who does not have a disease.
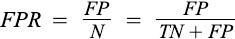
False Positive Rate (FPR), fall-out: It is the probability of a person testing positive who does not have a disease.
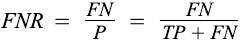
False Negative Rate (FNR), miss rate: It is the probability of a person testing negative who does have a disease.
TNR = TN/(TN+FP)
print("Specificity: ", TNR)
FPR = FP/(TN+FP)
print("FPR: ", FPR)
FNR = FN/(TP+FN)
print("FNR: ", FNR)
Output:
Specificity:  0.9752066115702479
FPR:  0.024793388429752067
FNR:  0.05970149253731343
Positive Predictive Value (PPV), Precision: It is the probability of a person having a disease who is tested positive. In other words, Precision is the proportion of correct predictions among all predictions.
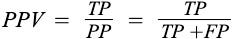
from sklearn.metrics import precision_score
precision_score(y_test, y_pred)
Output:
0.9672131147540983
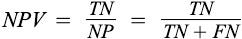
Negative Predictive Value (NPV): It is the probability of a person not having a disease who is tested negative.
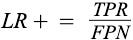
Positive likelihood ratio (LR+):
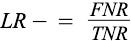
Negative likelihood ratio (LR-):
TNR = TP/(TP+FN)
NPV = TN/(TN+FN)
print("NPV: ", NPV)
LRp = TPR/FPR
print("LR+: ", LRp)
LRn = FNR/TNR
print("LR-: ", LRn)
Output:
NPV:  0.9672131147540983
LR+:  37.92537313432836
LR-:  0.06349206349206349
Accuracy: Accuracy is the proportion of examples that were correctly classified. To be more precise, It is the ratio of correct prediction over the total number of cases.

from sklearn.metrics import accuracy_score
accuracy_score(y_test, y_pred)
Output:
0.9627659574468085
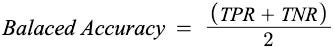
Balanced Accuracy: It is the arithmetic mean of TPR and TNR. Balanced Accuracy finds its usage where data imbalance exists.
from sklearn.metrics import balanced_accuracy_score
balanced_accuracy_score(y_test, y_pred)
Output:
0.9577525595164673
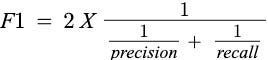
F1 Score: It is the harmonic mean of precision and recall, so it’s an overall measure of the quality of a classifier’s predictions. It is usually the metric of choice for most people because it captures both precision and recall. It finds its way during Data Imbalance.
from sklearn.metrics import f1_score
f1_score(y_test, y_pred)
Output:
0.9711934156378601
What is the difference between F1 and Balanced Accuracy?
F1 does not consider True Negative for evaluating the model, while Balanced Accuracy considers all four TP, TN, FP, and FN.
F1 is the composite metric where precision and recall are considered There are other composite metrics like precision-recall curve and ROC, and AUC, which are important to assess any classification model. To read more about these curves, please visit Precision-Recall and ROC Curve.
The below code is similar to the classification report of sklearn instead, it will give all metrics out of the confusion matrix for binary classification.
report = binary_classification_report(y_test, y_pred)
report
Output:
{'TP': 118,
 'TN': 63,
 'FP': 4,
 'FN': 3,
 'TPR': 0.9752066115702479,
 'Recall': 0.9752066115702479,
 'Sensitivity': 0.9752066115702479,
 'TNR': 0.9402985074626866,
 'Specificity': 0.9402985074626866,
 'FPR': 0.05970149253731343,
 'FNR': 0.024793388429752067,
 'PPV': 0.9672131147540983,
 'Precision': 0.9672131147540983,
 'Accuracy': 0.9627659574468085,
 'Balaced Accuracy': 0.9577525595164673,
 'F1 Score': 0.9711934156378601}
Note: all the above codes mentioned in the blog are for binary classification,
In this blog, we understood the confusion matrix for binary classification. However, if you are interested in multiclass, please refer to Multi-class Model Evaluation with Confusion Matrix and Classification Report and if you are wondering about the “from . import confusion_matrix”, please refer to the Introduction to Confusion Matrix for the Python method.
References:
[1] sklearn metrics API. https://scikit-learn.org/stable/modules/classes.html#module-sklearn.metrics
Deep dive into Confusion Matrix was originally published in Towards AI on Medium, where people are continuing the conversation by highlighting and responding to this story.
Join thousands of data leaders on the AI newsletter. It’s free, we don’t spam, and we never share your email address. Keep up to date with the latest work in AI. From research to projects and ideas. If you are building an AI startup, an AI-related product, or a service, we invite you to consider becoming a sponsor.
Published via Towards AI
Towards AI Academy
We Build Enterprise-Grade AI. We'll Teach You to Master It Too.
15 engineers. 100,000+ students. Towards AI Academy teaches what actually survives production.
Start free — no commitment:
→ 6-Day Agentic AI Engineering Email Guide — one practical lesson per day
→ Agents Architecture Cheatsheet — 3 years of architecture decisions in 6 pages
Our courses:
→ AI Engineering Certification — 90+ lessons from project selection to deployed product. The most comprehensive practical LLM course out there.
→ Agent Engineering Course — Hands on with production agent architectures, memory, routing, and eval frameworks — built from real enterprise engagements.
→ AI for Work — Understand, evaluate, and apply AI for complex work tasks.
Note: Article content contains the views of the contributing authors and not Towards AI.
Related posts
Recent Posts
")


")


