


Confusion Matrix to no Confusion Matrix in just 5mins
Last Updated on July 31, 2022 by Editorial Team
Author(s): Gowtham S R
Originally published on Towards AI the World’s Leading AI and Technology News and Media Company. If you are building an AI-related product or service, we invite you to consider becoming an AI sponsor. At Towards AI, we help scale AI and technology startups. Let us help you unleash your technology to the masses.
Confusion Matrix to No Confusion Matrix in Just 5mins
What is confusion matrix precision, recall, accuracy, F1-score, FPR, FNR, TPR, TNR?
In the beginning of your data science career, confusion matrix will be very confusing, we will be having lot of questions like, when to use precision ? when to use recall ? In which cases accuracy can be used ? So, I will try to answer these questions in this blog.
What is a confusion matrix?
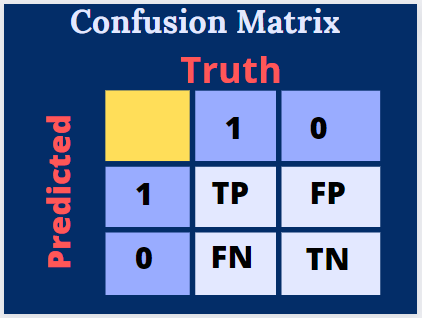
A confusion matrix is a method of summarizing the predicted results and actual values in the form of a matrix to measure the performance of a classification problem.
Here we represent predictions as Positive(P) or Negative(N) and truth values as True(T) or False(F).
Representing truth and predicted values together, we get True Positive (TP), True Negative (TN), False Positive(FP), and False Negative(FN).
So what are TP, TN, FP, and FN? Here we shall consider an example of a pregnancy test, where an actual pregnant woman and a fat man consult a doctor, and the test results are given in the below image.
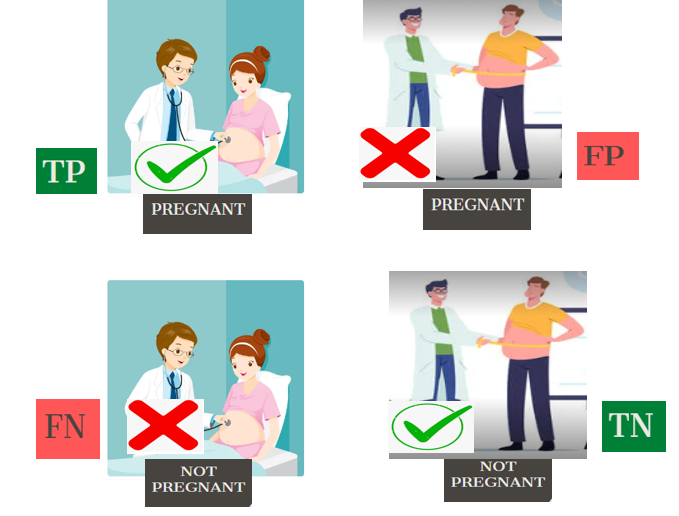
TP(True Positive): The woman is pregnant, and she is predicted as pregnant. Here P represents positive prediction, and T shows that our prediction is actually true.
FP(False Positive): A fat man is predicted as pregnant, which is actually false. Here P represents positive prediction, and F shows that our prediction is actually false. This is also called Type I error.
FN(False Negative): A woman who is actually pregnant is predicted as not pregnant. Here N represents negative prediction, and F shows that our prediction is actually false. This is also called Type II error.
TN(True Negative): A fat man is predicted as not pregnant. Here N represents Negative prediction, and T shows that our prediction is actually true.
In the confusion matrix, the diagonal elements (TP and TN) always represent the correct classifications, and the elements other than the diagonal represents incorrect classifications.
Accuracy:
Accuracy = (TP+TN)/(TP+FP+FN+TN) Accuracy gives the percentage of correct classifications. If we have 100 observations and our model classifies 80 observations correctly, then accuracy will be 80%. Accuracy alone cannot be used to decide whether our model is good or bad. Because our data has 900 positive and 100 negative classes, and if our model predicts all the observations as positive, then the model will be considered 90% accurate, which is not a good thing to do, so we use the following metrics as well.
Precision:
Precision = TP/(TP+FP) Out of all the positive predictions, how many were actually positive? Precision always focuses on positive predictions. Precision is also called a positive predictive value. We use precision whenever the False Positive result is important.
Eg: Email spam detection. Here False-positive occurs when the mail which is not spam is predicted as spam, and the user loses important information.
Recall:
Recall = TP/(TP+FN) Out of all the actual true values, how many were correctly predicted as positive? The recall is also called sensitivity or True positive rate (TPR). Recall always focuses on the actual positives. We use recall whenever the False Negative result is important.
Eg1: In a COVID Test, if a person with COVID is predicted as negative, then the error is False Negative. So, the person will not get the COVID treatment, and also, there is a chance that he will spread the disease.
Eg2: In fire alarm systems, we can use recall because a false negative alarm is more dangerous than a false positive.
F1 score:
F1 score = 2 * precision *recall/(precision + recall). This is a harmonic mean between precision and recall, and we can use the f1 score when we do not actually know whether FP is important or FN is important in our problem.
Other metrics:
True Negative Rate(TNR) = TN/(TN+FP)
False Positive Rate(FPR) = FP/(FP+TN)
False Negative Rate(FNR)= FN(FN+TP)
Dog Classification Model:
Now let us look at an example and understand how the above metrics can be applied in practice. Let us consider we are making a model to classify the images into one of 2 classes, Dog or Not a Dog.

The above images are the input to our model, the aim is to classify into dogs or not a dog.
Now let us look at the predictions done by our model.
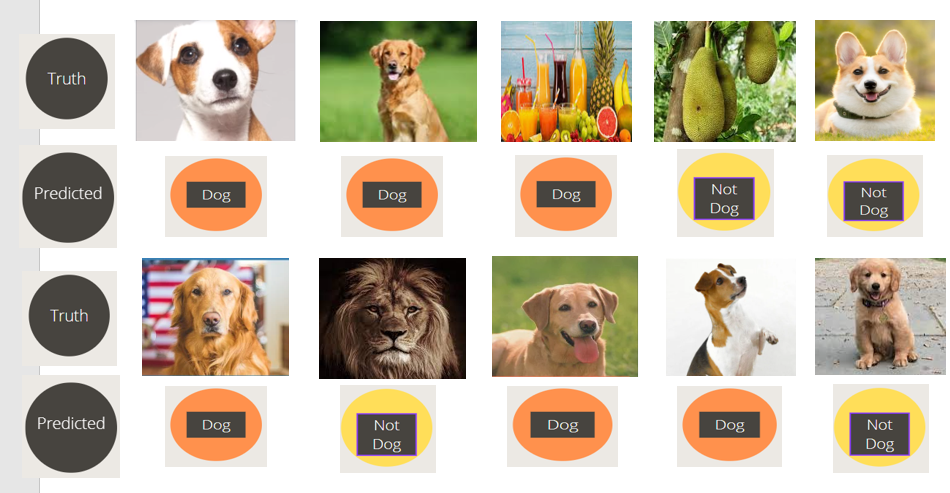
Our model result is dog prediction: 6 and Not a dog prediction: 4, we need to evaluate the predictions.
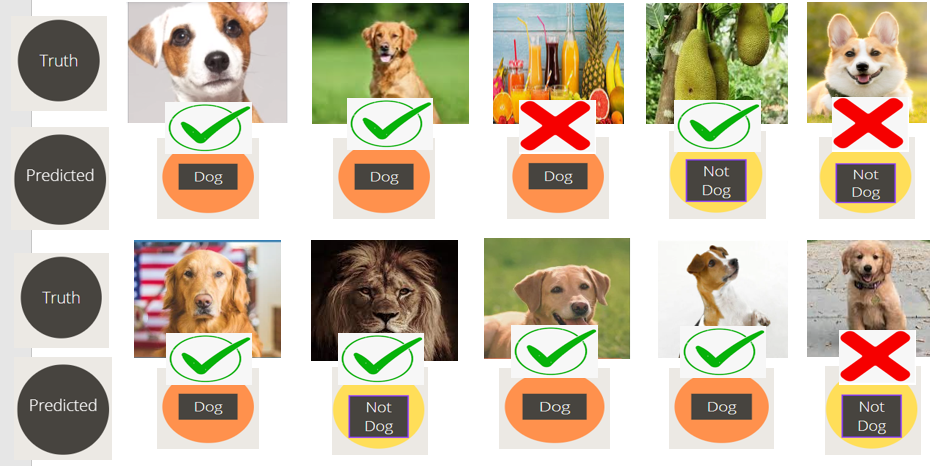
Out of 6 dog predictions, 5 are actually correct, and out of 4, not dog predictions 2 are actually correct.
Now let us look at how the above results can be represented in a confusion matrix and calculate accuracy, precision, recall, and f1 score.
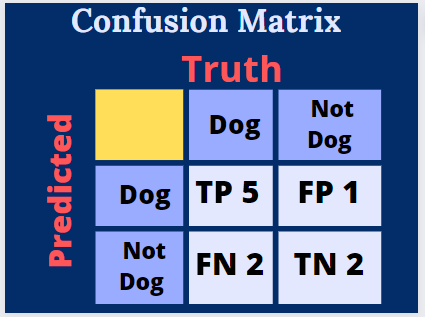
Accuracy = (TP+TN)/(TP+TN+FP+FN) = (5+2)/(5+2+1+2)=0.7
Precision = TP/(TP+FP) = 5/(5+1) = 0.83
Recall = TP/(TP+FN) = 5/(5+2) = 0.71
F1 score = 2*Precision*Recall/(Precision + Recall) =2*0.83*0.71/(0.83+0.71) = 0.77
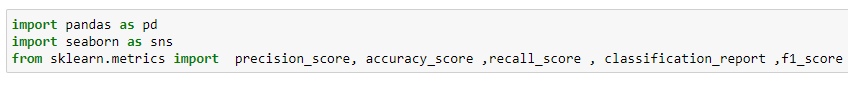
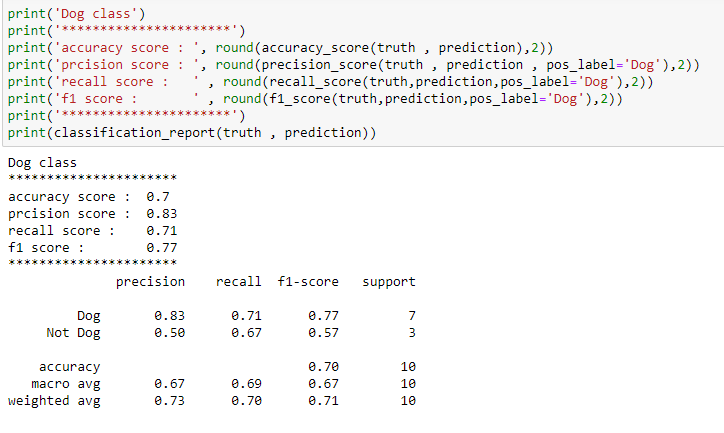
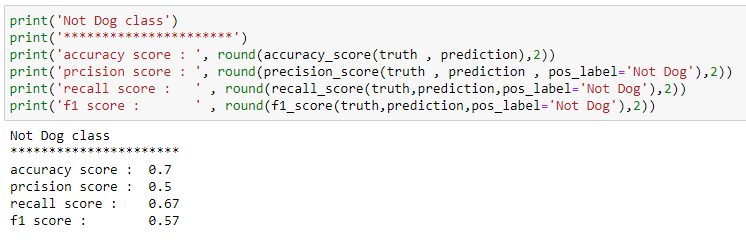
Note that we can calculate the precision, recall, and f1 score for the Not Dog class also, Now let us look at how we can calculate the above metrics with sklearn in python for the same example.

Now you should have no confusion about the confusion matrix. Also, if you have understood the above concepts well, then comment on some more examples where precision is preferred over recall and vice versa.
Anything that can go wrong will go wrong.
Want to get the knowledge on Regression metrics? below is the blog
If you want to know what is feature scaling? when to use standardization? when to use normalization? please read the below blog.
Which feature scaling technique to use- Standardization vs Normalization.
If you want to know how to analyze the IPL data, then please read the below blog.
You can connect with me on LinkedIn
Confusion Matrix to no Confusion Matrix in just 5mins was originally published in Towards AI on Medium, where people are continuing the conversation by highlighting and responding to this story.
Join thousands of data leaders on the AI newsletter. It’s free, we don’t spam, and we never share your email address. Keep up to date with the latest work in AI. From research to projects and ideas. If you are building an AI startup, an AI-related product, or a service, we invite you to consider becoming a sponsor.
Published via Towards AI
Towards AI Academy
We Build Enterprise-Grade AI. We'll Teach You to Master It Too.
15 engineers. 100,000+ students. Towards AI Academy teaches what actually survives production.
Start free — no commitment:
→ 6-Day Agentic AI Engineering Email Guide — one practical lesson per day
→ Agents Architecture Cheatsheet — 3 years of architecture decisions in 6 pages
Our courses:
→ AI Engineering Certification — 90+ lessons from project selection to deployed product. The most comprehensive practical LLM course out there.
→ Agent Engineering Course — Hands on with production agent architectures, memory, routing, and eval frameworks — built from real enterprise engagements.
→ AI for Work — Understand, evaluate, and apply AI for complex work tasks.
Note: Article content contains the views of the contributing authors and not Towards AI.
Related posts
Recent Posts


")

