An attempt to find out real results of 2021 Russia parliamentary elections using machine learning.
Last Updated on January 6, 2023 by Editorial Team
Last Updated on January 24, 2022 by Editorial Team
Author(s): Evgeny Basisty
Originally published on Towards AI the World’s Leading AI and Technology News and Media Company. If you are building an AI-related product or service, we invite you to consider becoming an AI sponsor. At Towards AI, we help scale AI and technology startups. Let us help you unleash your technology to the masses.
Machine Learning
Party “United Russia” has a majority of sits in Russian parliament ‘Duma” since 2003. In 2021 the ruling party won a decisive victory once again even though Russian citizens have not seen their income growth for more than 10 years. But was it that decisive? As often when matters concern politics one can easily find lots of convincing arguments proving quite opposite opinions. In such situations, it is always useful to investigate raw data. In this article, we will examine 2021 Russian parliament election results using well-known and reliable tools such as pandas, matplotlib, plotly, and sci-kit-learn. We will simulate two types of fraud: ballot staffing and vote misrecording. Based on simulation results we will teach a Logistic Regression model and let it judge whether any election fraud occurred during elections in 2021. In the end, we will create a table and a map that will indicate regions of Russia where problems with proper election results registration are more probable.
First, let’s describe some of the basic principles of the voting process in Russia, which are important in the context of this article. Elections in Russia are organized not by the state, but by independent election commissions. These commissions are formed from people who have multidirectional interests. In total, about 96,000 voting stations and, accordingly, commissions are usually formed at the federal elections. 1000–2000 people, who live in a compact area can vote in a medium-sized voting station. Almost any citizen of Russia can become a member of the commission and organize elections. The easiest way is to sign up to work in an election commission near the place of residence.
Whose interests do members of election commissions represent? First, the interests of various political parties that participate in the elections. So, for example, in many commissions, you would find representatives of the two largest parties in Russia at the time of this article writing — “United Russia”(UR) and “ Communist Party of the Russian Federation”(CPRF). In addition, in commissions, you can find ordinary citizens who consider it an important task to organize high-quality elections and are ready to sacrifice a significant amount of their personal time for this. There are non-profit organizations that try to coordinate the activities of such citizens. For example, the all-Russian public movement for the protection of voters’ rights “Golos”, was accused of foreign funding and labeled as a foreign agent month before the elections, in August 2021. In theory, all these multidirectional forces should balance each other and ensure the quality of votes counting. In many areas, this is exactly what happens. For example, in most offline polling stations in Moscow, this condition was met in the last elections and the victory, by a small margin, was won by the Communist Party of the Russian Federation.
However, for a group of people to cover all polling stations with their representatives, at least three people are needed per site. In a pandemic, the duration of the voting was increased to three days, which tripled the number of required man-hours. That is, each of the parties had to be represented by about 300,000 people, who would have to work for about 30 hours each. That is, it is about 9 million man-hours. With an average salary in Russia of 5 dollars per hour in 2021, more than 45 million dollars were needed just to control proper votes counting. The resources of the groups of people who organize elections are not equal. Even the official budget of United Russia was128 million dollars in 2020, while the official budget of the Communist Party of Russia was only 17 million. United Russia is the only that party has a sufficient budget to cover all the polling stations with enough of its representatives. Thus, there are areas where elections are organized by representatives of only the ruling party. It is not surprising that in such voting stations the quality of registration of election results can be significantly reduced.
In the 2021 elections 14 parties were allowed to participate. Nevertheless, big groups of people had none of their representatives registered in ballots because many well-known opposing politicians were not allowed to take part in elections. Many voters could choose the Communist party in such circumstances out of protest because it is the biggest opposing party in Russia. This year in many voting stations CPRF and UR got close results and it is very convenient to compare the results of the two parties.
Election results are open information that is available from Russia central voting commission site. In this study, we will use parsed and translated versions of results from file ‘stations.csv’. This file and source code is hosted on GitHub. Let’s load the data:
#%% Load data
import pandas as pd
stations = pd.read_csv('data/edata_eng.csv', index_col=0)
The dataset consists of information about election outcomes in 96307 voting stations. In the further investigation we will not consider stations with an electorate of fewer than a hundred voters to exclude results driven by artifacts from small numbers:
stations = stations[stations['total_voters']>100]
In the dataset, there are also voting stations with very unlikely results, where United Russia gets almost no votes, while some other minor party gets overwhelming results. Like on voting station number 1521 in the republic of Dagestan. There out of 1650 people who came to the station 1617 voted for the “Green Party” and nobody voted for United Russia. This is obviously unintentionally misrecorded results. We will filter out such stations by considering only the stations where there are more than 5 votes for United Russia:
stations = stations[stations['ur']>5]
Also, we will filter out online voting stations which were introduced this year in Moscow. This year very huge online voting stations were formed. Every online station electorate exceeds 100000 while there are no offline stations with an electorate greater than 5000. This and other reasons make it difficult to compare outcomes in online and offline stations.
stations = stations[stations['total_voters']<10000]
These filters bring a number of voting stations down to 92018.
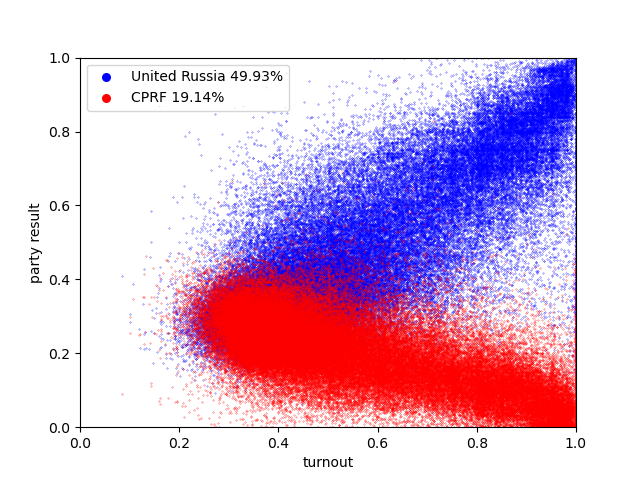
The best way to start analyzing data is to visualize it:

This figure shows the percentage of the United Russia and Communist party on the y-axis as a function of the voter turnout on the x-axis. Each pair of dots represents one of 92018 voting stations. Sometimes such a plot is called ‘election fingerprint’[1]. Two clusters on the plot can be seen. The dense core, where Communist party and United Russia have very close results: many red and blue dots overlap. And two tails at higher turnouts. As turnout increases result of United Russia increases in tales while the result of the Communist party decreases. Central Voting Commission did not find anything suspicious about such results and they were made official. However typically, in elections fingerprints in mature democracies tails cluster is absent. After a thorough examination of the plot in high turnouts, a grid structure can be discovered. This could be evidence of votes misrecording. Humans have a natural tendency to like round numbers and would more likely generate round outcomes. Lots of voting stations with round results would look like a grid on an election fingerprint.[2,3]
The balance in voting commissions is more likely to occur in densely populated areas because it is easier for opposing parties to find enough representatives to cover all voting stations.
Let’s examine the election fingerprint that could be observed on voting stations in five kilometers' proximity to the centers of 43 big cities in Russia. These stations elections results could be found in the ‘cities_ok_eng.csv’ file:
city_stations = pd.read_csv('data/cities_ok_eng.csv', index_col=0)
This subset of 2021 election results contains information about election results in 6602 voting stations where more than 12 million people could vote. In the figure below there is an election fingerprint for the subset.
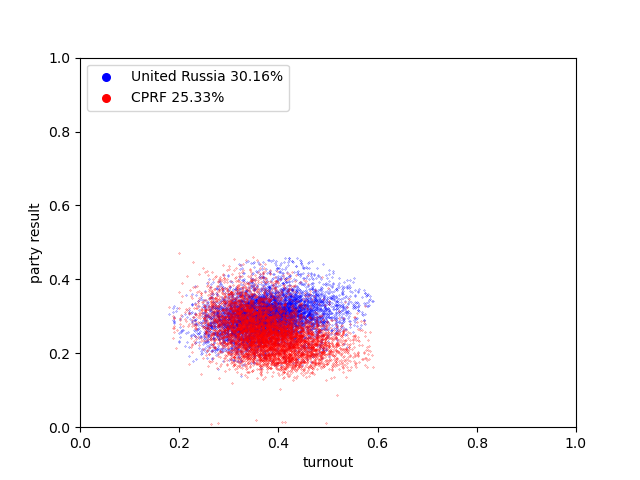
There is no “tails” cluster in this subset of election results. Let’s see what happens if we staff ballots to randomly selected voting city stations with a simple loop:
city_stations = city_stations.sample(frac=1)
city_stations['fraud'] = False

i = 0
ur_percent = city_stations['ur'].sum()/city_stations['voted'].sum()
for index, row in city_stations.iterrows():
    if ur_percent < 0.47:
        total_voters = row['total_voters']
        voted = row['voted']
        max_fraud = total_voters - voted
        min_fraud = max_fraud*0.05
        number = int(uniform(min_fraud, max_fraud))
        city_stations.loc[index, 'ur'] = row['ur'] + number
        city_stations.loc[index, 'voted'] = row['voted'] + number
        city_stations.loc[index,'fraud'] = True
        ur_percent = city_stations['ur'].sum()/city_stations['voted'].sum()

city_stations['turnout'] = city_stations['voted']/city_stations['total_voters']
city_stations['ur_percent'] = city_stations['ur']/city_stations['voted']
city_stations['cprf_percent'] = city_stations['cprf']/city_stations['voted']
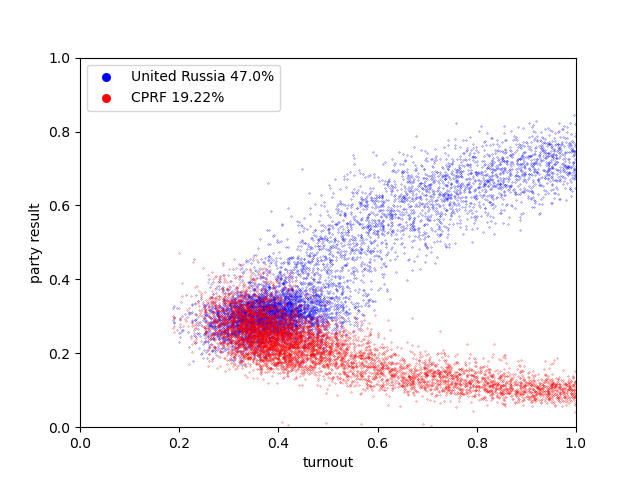
In the figure, United Russia results are limited to 80 percent. Let’s mis record results on some voting stations with this simple loop:
#%% Misrecording of votes till 49.8
city_stations_change = city_stations[~city_stations['fraud']]
for index, row in city_stations_change.iterrows():
    if ur_percent < 0.4982:
        total_voters = row['total_voters']
        random_voted = int(uniform(total_voters * 0.8, total_voters))
        voted = random_voted
        random_er = int(uniform(random_voted * 0.8, random_voted))
        city_stations.loc[index, 'voted'] = voted
        city_stations.loc[index, 'ur'] = int(random_er)
        city_stations.loc[index, 'cprf'] = int((random_voted - random_er)*0.3)
        city_stations.loc[index, 'fraud'] = True
        ur_percent = city_stations['ur'].sum() / city_stations['voted'].sum()

city_stations['turnout'] = city_stations['voted']/city_stations['total_voters']
city_stations['ur_percent'] = city_stations['ur']/city_stations['voted']
city_stations['cprf_percent'] = city_stations['cprf']/city_stations['voted']
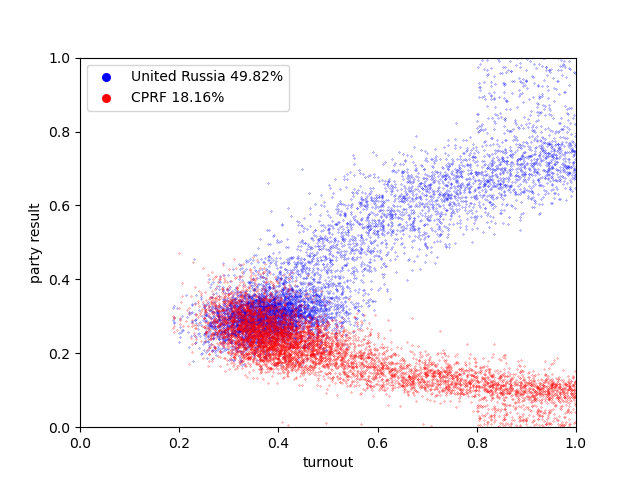
As far as we marked stations with falsifications adding the ‘fraud’ column to the data frame, we can distinguish easily between stations without fraud:
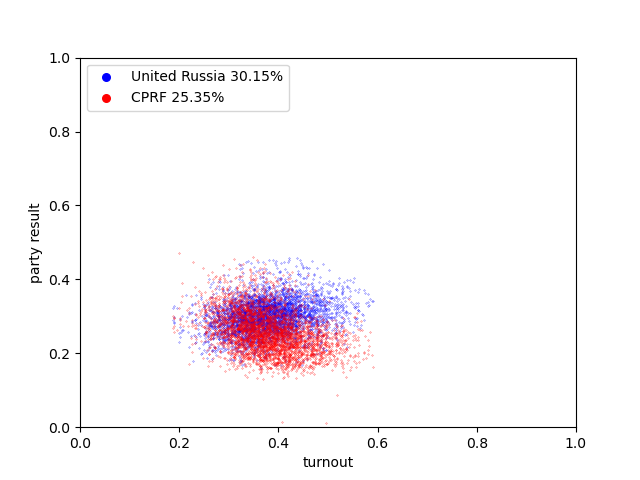
And with fraud:
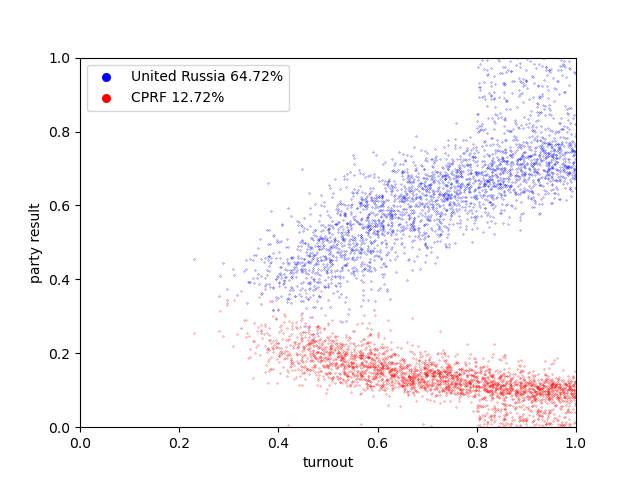
We can also train a model that will be able to predict whether there was a fraud in a particular voting station:
#%% Teach Logistic Regression model on city stations
from sklearn.pipeline import Pipeline
from sklearn.preprocessing import StandardScaler
from sklearn.linear_model import LogisticRegressionCV
pipe = Pipeline([("scale", StandardScaler()), ("model", LogisticRegressionCV())])
pipe.get_params()
X = city_stations[['ur','cprf', 'voted','total_voters']]
y = city_stations['fraud']
pipe.fit(X, y)
Now let’s apply the model to the initial data set with information about election outcomes on all polling stations in Russia:
#%% Apply model to all stations
stations['turnout'] = stations['voted']/stations['total_voters']
stations['ur_percent'] = stations['ur']/stations['voted']
stations['cprf_percent'] = stations['cprf']/stations['voted']
Xx = stations[['ur','cprf', 'voted','total_voters']]
prediction = pipe.predict(Xx)
prediction
stations['prediction'] = prediction
The model suspects that in 40219 voting stations fraud occurred:
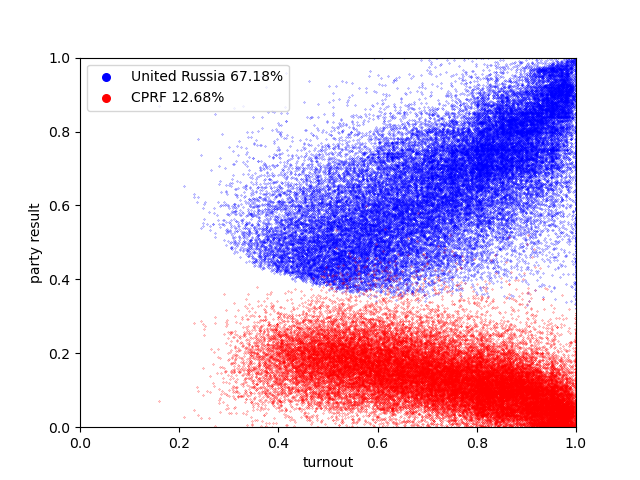
But there are where 51799 stations where elections were fair:
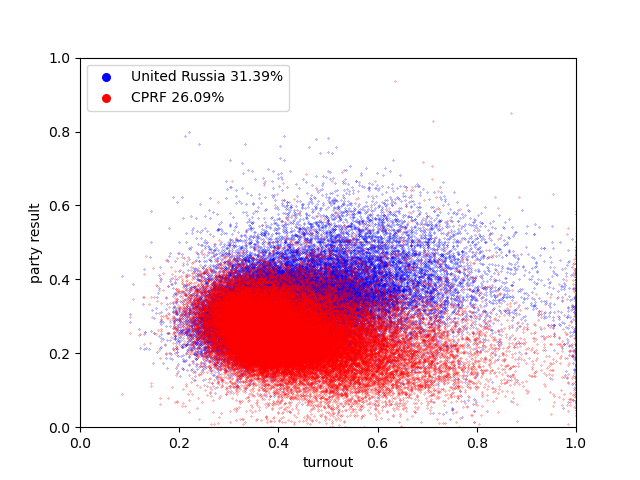
If we assume that the average result in stations with fraud was the same as in stations without fraud, we can calculate a number of ballots that had to be staffed to achieve a 49.9 percent result:
stations_ok = stations[stations['prediction'] == False]
stations_fraud = stations[stations['prediction'] == True]
ur_true = stations_ok['ur'].sum()/stations_ok['voted'].sum()
ur_fraud = stations_fraud['ur'].sum()/stations_fraud['voted'].sum()
round(stations_fraud['voted'].sum()*ur_true/ur_fraud)
12993185
The number of ballots stuffed is close to 13 million according to the model prediction. Well-known election analyst Sergey Shpilkin suggested that around 14 million of United Russia’s official votes were fraudulent.[4]
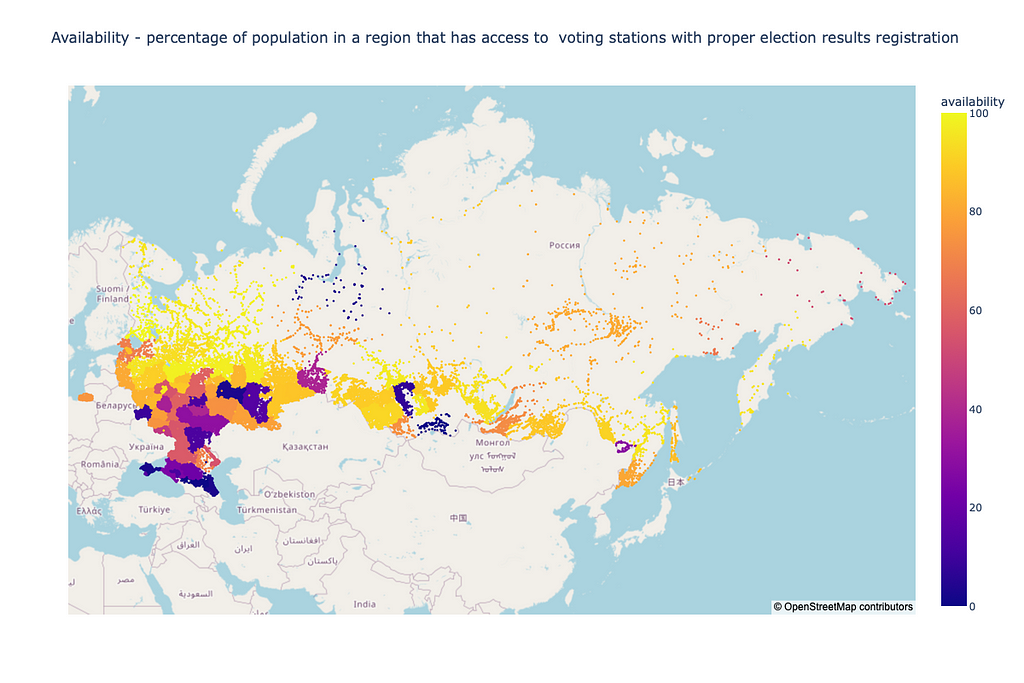
We can also now present a table with the results of the investigation for each region. In the table, we represent a parameter called “Availability”. This parameter shows the percentage of the population of a region that has access to voting stations with good quality of election results registration:
If we add availability feature to every polling station we can visualize the information from the table on a map:
Conclusion:
- · As a result of the simulation of election fraud, a new cluster appears in the electoral fingerprint of big cities election results subset. The cluster has much in common with the ‘tails’ cluster of election fingerprints of all voting stations in Russia.
- · Logistic regression model trained on simulated election fraud suggests that most of the voting stations in the tails cluster of 2021 parliament results had ballot stuffing or votes misrecording.
- · The model predicted that about 13 million votes were falsified in favor of the United Russia party.
- · Voting stations with proper results registration might not be available to the majority of the population in the southern regions of Russia.
[1] Thurner S, Klimek P, Election forensics of the Russia 2021 elections statistically indicate massive election fraud(2021), CSH Policy Brief
[2] Kobak D, Shpilkin S, Pshenichnikov M S, Integer percentages as electoral falsification fingerprints(2016), Annals of Applied Statistics
[3] Kobak D, Shpilkin S, Pshenichnikov M S, Statistical fingerprints of electoral fraud?(2016), Significance (Royal Society)
[4] Cordell J, Statisticians Claim Half of Pro-Kremlin Votes in Duma Elections Were False(2021), The Moscow Times
An attempt to find out real results of 2021 Russia parliamentary elections using machine learning. was originally published in Towards AI on Medium, where people are continuing the conversation by highlighting and responding to this story.
Join thousands of data leaders on the AI newsletter. It’s free, we don’t spam, and we never share your email address. Keep up to date with the latest work in AI. From research to projects and ideas. If you are building an AI startup, an AI-related product, or a service, we invite you to consider becoming a sponsor.
Published via Towards AI
Take our 90+ lesson From Beginner to Advanced LLM Developer Certification: From choosing a project to deploying a working product this is the most comprehensive and practical LLM course out there!
Towards AI has published Building LLMs for Production—our 470+ page guide to mastering LLMs with practical projects and expert insights!

Discover Your Dream AI Career at Towards AI Jobs
Towards AI has built a jobs board tailored specifically to Machine Learning and Data Science Jobs and Skills. Our software searches for live AI jobs each hour, labels and categorises them and makes them easily searchable. Explore over 40,000 live jobs today with Towards AI Jobs!
Note: Content contains the views of the contributing authors and not Towards AI.


