
A Trustworthy Model for Loan Eligibility Assessment
Author(s): Becaye Baldé
Originally published on Towards AI.
A model with high-performance metrics might convince a Data Scientist but is unlikely to earn the trust of domain experts if it can’t justify its decisions.

In this article, we are going to build and deploy an interpretable machine-learning model to assess housing loan eligibility. Below is a glimpse of the final result:
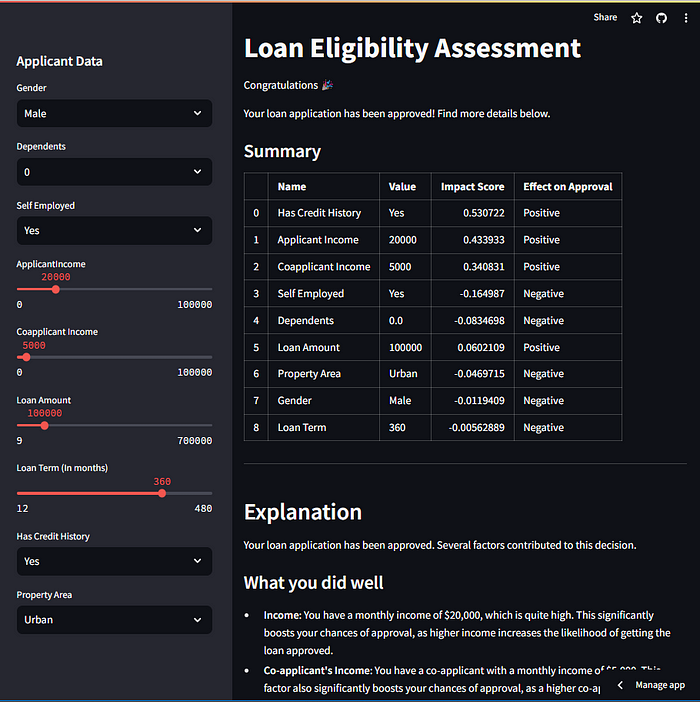
You can try the app here: https://loan-eligibility.streamlit.app/ or jump to the fourth section to see the results.
Please, not that the app might go down when it reaches its maximum budget allowed.
From a more technical perspective, this is what will build:

This article was written with both non-technical and technical readers in mind. It is structured in four sections:
- I — Building the model: In this section, we build the machine learning model.
- II — Opening the black box & mitigating biases: In this section, we try to understand the model’s reasoning by looking at the impact of each variable on the predictions and, ultimately, addressing biases.
- III — Generating the report: In this section, we prompt GPT to generate a report explaining the model’s decision.
- IV — Deploying the model as a web application: In this section, we deploy a Streamlit web application that uses the model to assess an applicant’s eligibility and generate a report explaining the model’s decision using GPT-3.5.
The whole project can be found here: https://github.com/BecayeSoft/Loan-Eligibility-Modeling.
I also included a notebook for each section to make it more intuitve for technical readers to understand the code.
I. Building the Machine Learning Model
The Plot Twist U+1F47B
Loan officers need a new way of accelerating the processing of housing loan applications. They already have records of past applications. You, as a seasoned data scientist, decide to use this data to build a machine learning model that predicts if a person is eligible or not for a loan.
After a month of countless experimentations, your model reaches good performance with an average precision (AP) of 92%. A model making random predictions in this scenario would have an average precision of 69%.
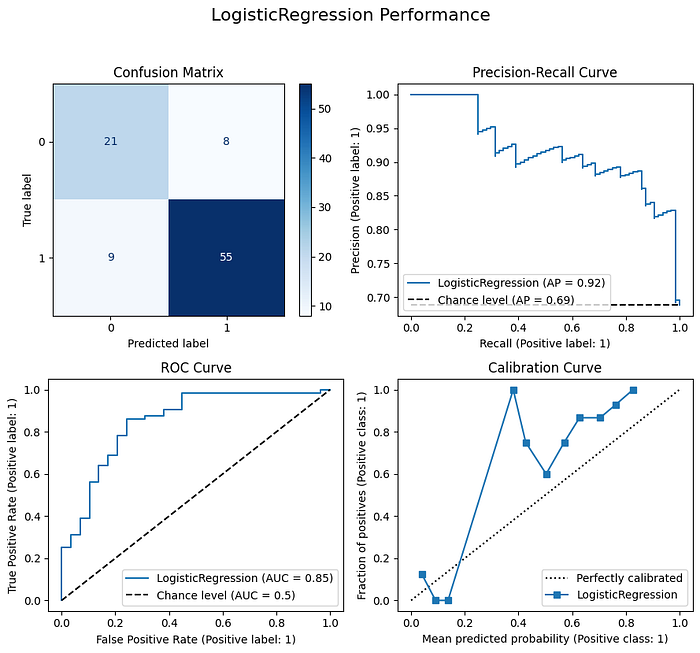
You are satisfied with your model’s performance, so you deploy it.
This notebook details how I trained the model: https://github.com/BecayeSoft/Loan-Eligibility-Modeling/blob/main/notebooks/training.ipynb
The Problem U+1F627
A week later, an applicant named Aria Stark complained because her application was rejected and threatened the company. How do you explain that rejection? While the metrics show that your model is significantly better than random guessing, that is not enough to convince a human.
You have no idea about what is happening under the hood. The model might be accurate while exhibiting biased or illogical reasoning. What if your model rejects more or less loans based on gender or education level? Let’s find out.
A Possible Solution U+1F4A1
There are several techniques to explain Machine Learning models. My favorite one is by using SHAP (SHapley Additive exPlanations) values. SHAP values quantify the impact of individual variables on a model’s predictions.
II. Opening the Black Box & Mitigating Biases
Alright, enough with the emojis. In this section, we will try to understand how the model makes its predictions.
This notebook details how I generated the model’s explanations (SHAP values).
We begin by creating an explainer for the test data using the shap library, then visualize the explanations.
import shap

# Create an explainer
explainer = shap.LinearExplainer(classifier, X_test)
shap_explanation = explainer(X_test)
Explaining Global Predictions
How does the model globally make predictions on the test data? To answer that question, we generate a SHAP summary plot — a simple, yet incredibly informative graph.
shap.plots.beeswarm(shap_explanation, max_display=100)

Here is how to interpret the graph:
1. SHAP Values: The SHAP values are on the X-axis. SHAP values greater than 0 push the prediction toward approval, while the ones lower than 0 push the prediction toward rejection.
2. Colors: Colors close to red indicate high values; Colors close to blue indicate small values.
For instance, if a point is after the vertical line (SHAP value > 0) it moves the prediction towards approval. If this point is blue, it indicates that its value is low.
To provide further clarity, let’s look at the graph once again and observe some interesting logic:

- Credit History: according to the model, a person with no credit history (blue = 0 or no credit) is unlikely to get approved, which makes sense.
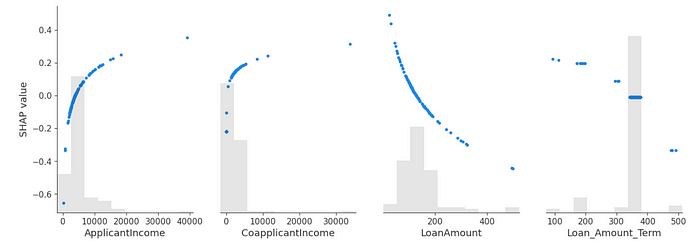
- Loan amount: higher loan amounts move the prediction toward rejection. It also makes sense that higher loan amounts reduce the chances of approval.
- Gender: gender has little effect on the prediction, which is good.
The graph below provides a clearer illustration of how the numerical variables impact the predictions, aligning with the insights presented in the summary graph:
# Plot the first 4 variables
shap.plots.scatter(shap_explanation[:, 0:4])
Now let’s understand why Aria Stark’s application was rejected.
Individual Explanation
Her application number is 10:
pred = model.predict(X_test.iloc[[10]])
print('Approved' if pred == 1 else 'Rejected')
Rejected
Why was she rejected? Let’s find out using a waterfall plot:
shap.plots.waterfall(shap_explanation[88], max_display=7)

Which variables played in her favor?
- An existing credit history.
- The property being in a rural area.
Which variables reduce her chances of approval?
- Not being married.
- Not having graduated.
- Her co-applicant — Jon Snow 🙂 — having no income
Mitigating biases
The fact that the model associates marital status with approval may come from biases in the company’s decision-making process. While common perception may associate marital status with responsibility, this could lead the model to overlook some qualified candidates. Another concern is that the model tends to favor those with a degree.
Therefore, these features were removed from the model. The new model shows similar performances. The AUC dropped from 0.87 to 0.85, but the average precision remains the same.
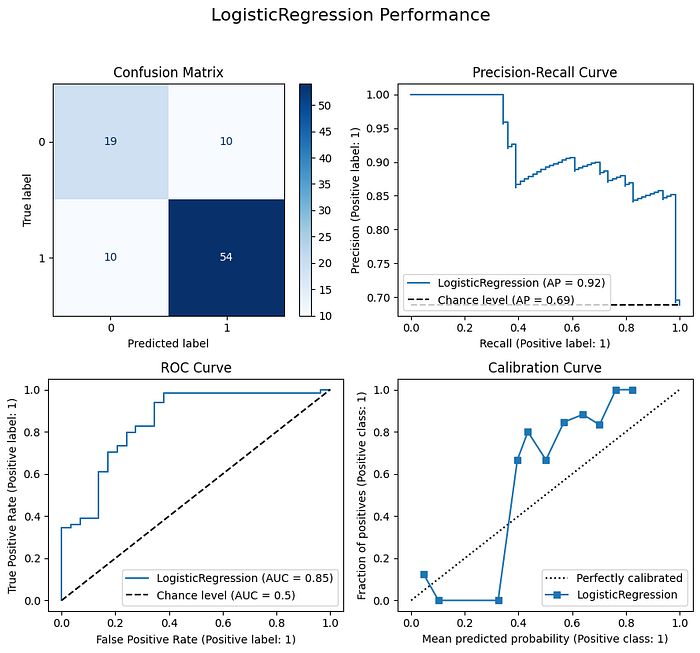
Now, if we take a look at Aria Stark’s application investigated earlier, we observe that the education level and marital status no longer impact the prediction:
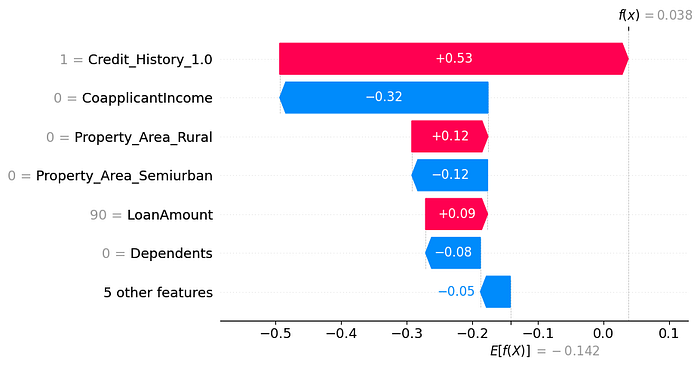
That’s it! Now, that our model is an open box, there will be no more “What do you mean your model has a good f1-score? U+1F627” from loan officers. Plus, Aria Stark can now withdraw her complaint.
The model is still far from being perfect (see the improvement section at the end) but we will stop here to avoid making this article too long.
III. Generating the report
Let’s make things even more interesting! We are going to leverage GPT to generate a report explaining the model’s decision in a way that anyone can easily understand.
Here is what our workflow looks like:

We have a few steps:
- The user enters some data.
- The data is processed and sent to the model.
- The model predicts the eligibility of the applicant.
- The impact of each feature is derived by computing SHAP values.
- The SHAP values are formatted into a more informative JSON object to enhance their interpretability for GPT-3.5. A prompt is then created by combining the model’s predictions and SHAP values with some instructions. Finally, the prompt is sent to GPT-3.5.
- GPT-3.5 returns a response.
Formatting the SHAP Values
If you look at the notebook GPT_insights, you will see that for each variable, we generate explanations using the following format:
{'Name': 'Dependents', 'Value': 2.0, 'SHAP Value': 0.12153182486780074, 'Effect on Approval': 'Positive'}
- Name: name of the variable.
- Value: of the variable.
- SHAP value of the variable.
- Effect on approval: “Positive” when the SHAP value is greater than 0. “Negative” otherwise.
I recommend exploring the notebook GPT_insights for a better understanding.
Crafting Prompts
Now, let’s examine the prompts that I used. Below is the system prompt telling GPT how to behave:
system_prompt = """
The system evaluates loan applications using applicant data.
You need to explain the system's decision, considering features and their impacts, and this explanation is tailored for the non-technical applicant.
No greetings or closings are necessary.
Emphasize the features that had the most influence on the system's decision and how they affected that decision.
When you mention a feature, include the feature's name and value.
Use the term "system" to reference the model and avoid technical jargon related to the SHAP values.

IMPORTANT
---------
Higher ApplicantIncome, CoapplicantIncome and LoanAmount are associated with a higher probability of approval.
Higher LoanAmount and Loan_Amount_Term are associated with a lower probability of approval.
Loan Amount ranges from $9 to $700 (in thousands).
Loan Amount Term ranges from 12 to 480 months.
"""
This is the prompt I used to ask GPT to generate the report:
query = f"""
Below are the definitions of the features:
- Dependents: Number of dependents of the applicant
- ApplicantIncome: Income of the applicant
- CoapplicantIncome: Income of the co-applicant
- LoanAmount: Loan amount
- Loan_Amount_Term: Term of the loan in months
- Gender: then gender of the applicant
- Self Employed: wheather the applicant is self-employed or not
- Property Area:Rural: "Yes" if the property is in a rural area, "No" otherwise
- PropertyArea: Semiurban: "Yes" if the property is in a semiurban area, "No" otherwise
- Property_Area: Urban: "Yes" if the property is in an urban area, "No" otherwise
- Has Credit History: "Yes" if the applicant has a credit history, "No" otherwise

Below are the names, values, SHAP values, and effects for each prediction in a JSON format:
{explanation_jsons}

Below is the prediction of the model:
Predicted status: {predicted_status}
Probability of approval: {predicted_proba}%

-----
Based on the information on feature names, values, SHAP values, and effects,
generate a report to explain the model's decision in simple terms.
Below is an example of response so that you can get the pattern,
rewrite it to fit the current context based on the information above
but Keep the same markdown structure (e.g. for the level 3 titles ###).
The bulleted list should be ordered by magnitude of impact.
{response_template}

Conclude with a summary of the most important factors and their effects on the decision.

Recommend actions to improve the chances of approval.
"""
Notice the variables in curly brackets “{}”:
- explanations_json: a list of dictionaries where each dictionary contains the name of a feature, its value, its SHAP value and its effect on the prediction. Just like we saw earlier in “Formatting the SHAP Values”.
- predicted_status: the predicted status of the loan application: “approved” or “rejected”.
- predicted_proba: the predicted probability of the application’s approval.
- response_template: An example providing GPT with more context to ensure its responses are closer to what we expect.
After processing Aria Stark’s application, we get this final prompt:
Below are the definitions of the features:
- Dependents: Number of dependents of the applicant
- ApplicantIncome: Income of the applicant
- CoapplicantIncome: Income of the co-applicant
- LoanAmount: Loan amount
- Loan_Amount_Term: Term of the loan in months
- Gender: then gender of the applicant
- Self Employed: wheather the applicant is self-employed or not
- Property Area:Rural: "Yes" if the property is in a rural area, "No" otherwise
- PropertyArea: Semiurban: "Yes" if the property is in a semiurban area, "No" otherwise
- Property_Area: Urban: "Yes" if the property is in an urban area, "No" otherwise
- Has Credit History: "Yes" if the applicant has a credit history, "No" otherwise

Below are the names, values, SHAP values, and effects for each prediction in a JSON format:
[{'Name': 'Dependents', 'Value': 0.0, 'SHAP Value': -0.08346984991178112, 'Effect on Approval': 'Negative'}, {'Name': 'Applicant Income', 'Value': 5720, 'SHAP Value': 0.14706541892812847, 'Effect on Approval': 'Positive'}, {'Name': 'Coapplicant Income', 'Value': 0, 'SHAP Value': -0.3171539419119009, 'Effect on Approval': 'Negative'}, {'Name': 'Loan Amount', 'Value': 110000, 'SHAP Value': 0.029009653363208033, 'Effect on Approval': 'Positive'}, {'Name': 'Loan Amount Term', 'Value': 360, 'SHAP Value': -0.005628890210890795, 'Effect on Approval': 'Negative'}, {'Name': 'Gender', 'Value': 'Male', 'SHAP Value': -0.011940938055301362, 'Effect on Approval': 'Negative'}, {'Name': 'Self Employed', 'Value': 'No', 'SHAP Value': 0.026858270835239666, 'Effect on Approval': 'Positive'}, {'Name': 'Property Area', 'Value': 'Urban', 'SHAP Value': -0.04697147224187069, 'Effect on Approval': 'Negative'}, {'Name': 'Has Credit History', 'Value': 'Yes', 'SHAP Value': 0.5307220385544934, 'Effect on Approval': 'Positive'}]

Below is the prediction of the model:
Predicted status: [1]
Probability of approval: 51%

-----
Based on the information on feature names, values, SHAP values, and effects,
generate a report to explain the model's decision in simple terms.
Below is an example of response so that you can get the pattern,
rewrite it to fit the current context based on the information above
but Keep the same markdown structure (e.g. for the level 3 titles ###).
The bulleted list should be ordered by magnitude of impact.

Your loan application has been approved. Several factors contributed to this decision.

### What you did well
- **Income**: You have an income of \$4,235. This factor significantly boosts your chances of approval as a higher income increases the likelihood of getting the loan approved.
- **Co-applicant's Income**: You have a co-applicant with an income of \$3000. This factor significantly boosts your chances of approval, as a higher co-applicant income increases the likelihood of getting the loan approved.
- **Requested Loan Amount:** Your loan request of \$77,000 falls within the lower range of our allowable amount, which spans from \$9,000 to \$700,000. This contributed positively to the approval decision.
- **Credit History:** You have a credit history, which is required for loan approval.

### What you need to work on
- **Loan Term Duration:** The chosen loan term of 360 months (30 years) exceeds the midpoint in our range of 12 to 480 months. Opting for a longer loan term slightly diminishes your chances of approval.

IMPORTANT:
- Do not mention the gender as it is not a factor to improve or work on.
- Do not recommend improve the applican't or co-applicant's income as it is not something that can be improved.


Conclude with a summary of the most important factors and their effects on the decision.

Recommend actions to improve the chances of approval.
Generating responses
And then we send this prompt to GPT to get a response:
completion = openai.chat.completions.create(
 model="gpt-3.5-turbo",
 messages=[
 {"role": "system", "content": system_prompt},
 {"role": "user", "content": query}
 ]
)

response = completion.choices[0].message.content
print(response)
GPT-3.5 reformulates the technical stuff into simple language and we get this response:
Congratulations! Your loan application has been approved. The system evaluated several factors to make this decision. Let's take a closer look at these factors and their effects on the approval decision.

### Factors that contributed to the approval decision:

- **Income**: Your income of $5,720 positively influenced the approval decision. A higher income increases the likelihood of getting the loan approved.

- **Credit History**: Having a credit history played a significant role in the approval decision. The system considers this as a crucial factor, and your credit history being positive positively impacted the decision.

- **Requested Loan Amount**: The system took into account the loan amount you requested, which was $110,000. This amount falls within the acceptable range of loan amounts, which spans from $9,000 to $700,000. Your loan request contributed to the approval decision.

### Factors to be aware of:

- **Loan Term Duration**: The chosen loan term of 360 months (30 years) slightly diminished your chances of approval. The system prefers loan terms that are closer to the midpoint of the acceptable range, which is from 12 to 480 months.

To summarize, the most significant factors that influenced the system's decision were your income, credit history, and the loan amount you requested. These factors significantly contributed to the approval decision.

To improve your chances of approval in the future, it would be beneficial to consider the following actions:

- Opt for a loan term duration closer to the midpoint of the acceptable range. This could increase your chances of approval.

It's important to remember that the approval decision depends on various factors, and the system considers them collectively. By considering these areas for improvement, you can increase the likelihood of approval for future loan applications.
Now, let’s put this all together in a web application.
IV. Deploying the Model in a Web Application
The web application was built using Streamlit.
The app is hosted at: https://loan-elibility.streamlit.app/.
The code can be found at: https://github.com/BecayeSoft/Loan-Eligibility-Modeling in the “src” folder.
In the final result, we have an interface that enables users to enter their data and obtain the result:
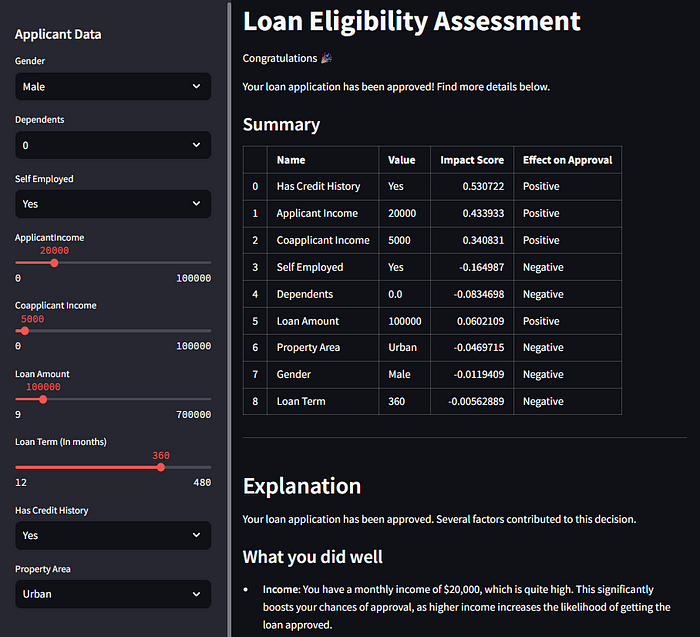
When we scroll down, we get the generated report:
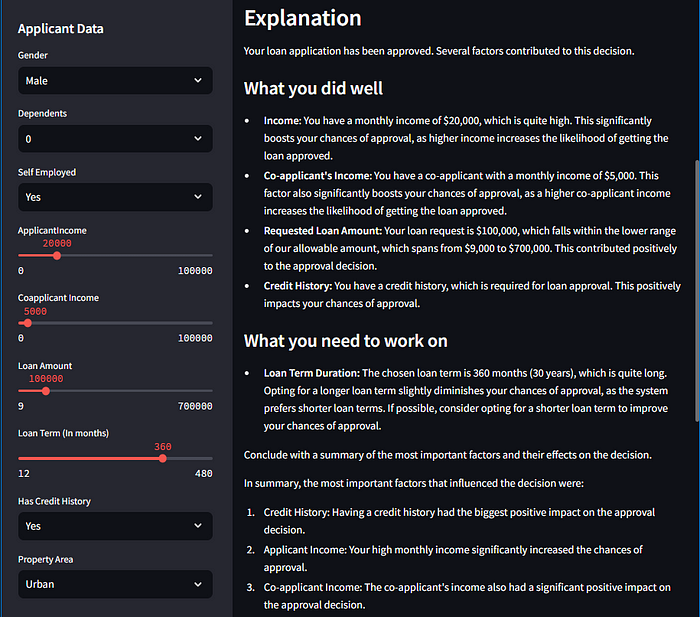
We even get some recommendations:

Finally, the last part shows a waterfall plot highliting the impact of each feature on the model’s decision:

That’s it. We built a nice, creative, and useful system!
Going further
In this article, we have only scratched the surface of potential improvements to the system. There is a lot of room for improvement. Here are a few ideas:
- Biases Mitigation: While we briefly examined some biased variables, there are likely others we haven’t addressed.
- Model Performance: Clearly, there’s an opportunity to engineer additional features such as “Total Income,” “Income — Loan Ratio,” and many more.
- Prompting: While I carefully and iteratively refined the prompts, there is always room for improvement, which could improve the responses from GPT-3.5 and/or reduce usage costs.
- Additional interpretability techniques: While SHAP values are intuitive and pretty cool, other methods can help further demystify the black box, like permutation importance, partial dependence plots, and ICE. Exploring how changes in variables, such as gender, influence predictions is also worth considering.
I also recommend this website to learn more about Machine Learning interpretability.
References
- https://shap.readthedocs.io/en/latest/example_notebooks/overviews/An%20introduction%20to%20explainable%20AI%20with%20Shapley%20values.html
- https://docs.streamlit.io/streamlit-community-cloud/deploy-your-app
- https://platform.openai.com/docs/guides/text-generation/chat-completions-api
Join thousands of data leaders on the AI newsletter. Join over 80,000 subscribers and keep up to date with the latest developments in AI. From research to projects and ideas. If you are building an AI startup, an AI-related product, or a service, we invite you to consider becoming a sponsor.
Published via Towards AI
Take our 90+ lesson From Beginner to Advanced LLM Developer Certification: From choosing a project to deploying a working product this is the most comprehensive and practical LLM course out there!
Towards AI has published Building LLMs for Production—our 470+ page guide to mastering LLMs with practical projects and expert insights!

Discover Your Dream AI Career at Towards AI Jobs
Towards AI has built a jobs board tailored specifically to Machine Learning and Data Science Jobs and Skills. Our software searches for live AI jobs each hour, labels and categorises them and makes them easily searchable. Explore over 40,000 live jobs today with Towards AI Jobs!
Note: Content contains the views of the contributing authors and not Towards AI.


