Diagnosing Parkinson’s Disease Using Voice Sample Data Analysis: Features Selection
Last Updated on November 5, 2023 by Editorial Team
Author(s): Mahesh Tiwari
Originally published on Towards AI.

Overview
A neurological condition known as Parkinson’s Disease (PD) is characterised by increasing movement abnormalities that damage the nervous system. Despite its widespread occurrence, the illness has no recognized remedy. Due to the absence of accurate diagnostics and the invasiveness of existing techniques, PD diagnosis is difficult. Processing speech sample data is being investigated as a non-invasive diagnostic method. The objective of our study is to identify distinct vocal traits in those with PD and those without it in order to make this distinction. Examining these auditory signs can help in the development of a simple and reliable PD diagnostic tool, which is the goal of this study.
This study makes use of the dataset, which contains speech samples from both PD patients and healthy people. 26 speech samples, comprising words, phrases, sustained vowels, and digits, were recorded by the participants. The inquiry is based on acoustic parameters that were obtained using the free acoustic analysis software Praat. The goal of this research is to aid in the creation of a reliable and practical PD diagnostic tool.
The data named po1_data.txt can be found in this GitHub repository and Python code Parkinson_Diseaase_Feature_Selection.py.
Understanding Data
The dataset has 1039 entries and 29 columns with various acoustic elements. The data was loaded and preprocessed. Luckily, this doesn’t contain null values and duplicated entries. The dataset is divided into two data subsets: those without Parkinson’s disease (healthy) and those with it (affected). The proportion of persons with and without PD is almost equal. The subsets will be used for comparative analysis and visualization to explore differences between healthy and PD-affected individuals. The updated column names provide insights into the acoustic attributes they represent.

Descriptive Analysis
Two sub-datasets of people with and without Parkinson’s disease (PD) were analyzed in the study to better understand the variations in central tendencies and variability. Using the.describe() method, summary statistics were computed by omitting extraneous fields like “subject_id.” To get insight into how PD affects these traits, differences in important statistics were computed, concentrating on mean, median, and standard deviation.

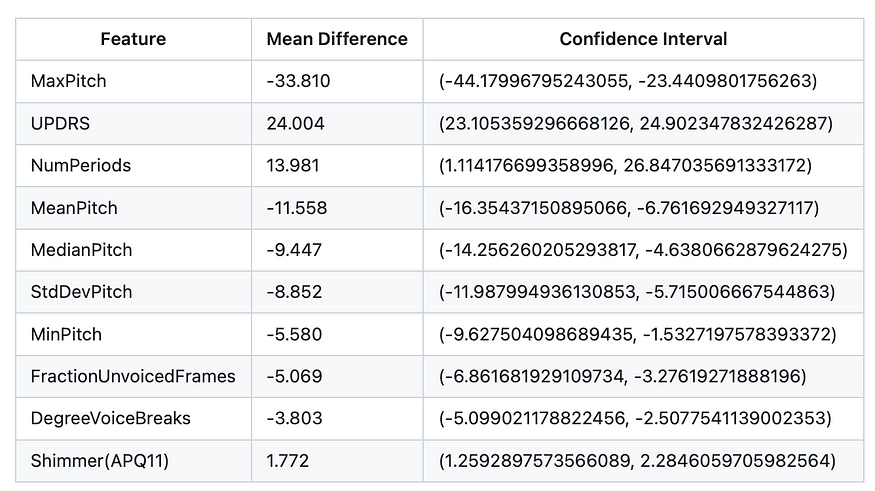
The feature selection indicated substantial variations across datasets with and without Parkinson’s disease, with “MaxPitch” showing the biggest difference at 33.81. Additionally, the study revealed disparities in severity ratings, speech pattern characteristics, and mean and median values for “MeanPitch,” “MedianPitch,” and “StdDevPitch.” These findings shed light on important characteristics that should be distinguished between Parkinson’s disease patients and healthy individuals.
Histogram
The distribution of numerical characteristics of healthy and unwell participants is compared in this study using side-by-side histograms.

With regard to characteristics like jitter measures, the histograms reveal discrepancies in the feature distributions between the two groups. Voice variability characteristics exhibit varied degrees of dispersion and skewness, with “Shimmer” displaying a “APQ5” distribution. While “NHR” has a positively skewed distribution, suggesting data skewness towards higher values, harmony has a mean of 0.85 and a standard deviation of 0.09 compared to these values. Strongly positively skewed features like “NumPulses” and “NumPeriods” point to probable outliers or variability. The distributions of attributes like “MeanPeriod” and “StdDevPeriod” are close to zero, indicating limited variance. ‘UPDRS’ exhibits a right-skewed distribution, presumably suggesting the severity of Parkinson’s disease.
Box Plotting

Voice recording properties include pitch variations, vocal intensity shifts, harmonics-to-noise ratios, and temporal patterns that show outliers, which may signify atypical pitch modulation, rapid changes in voice intensity, departures from harmonics, or changes in speech rate. The interpretation of these outliers depends on the context and calls for subject-matter knowledge. Handling these outliers with care is important because they reveal important details about the underlying voice traits and behaviors in recordings.
Inferential Statistical Analysis
Mean Differences and Confidence Intervals

The mean MaxPitch value for the Parkinson’s disease group is 33.810 Hz lower than the mean MaxPitch value for the control group in this study, according to the mean difference for the MaxPitch feature, which is -33.810. We may be 95% certain that the actual difference in mean MaxPitch values is between -44.17996795243055 Hz and -23.4409801756263 Hz since the confidence interval for this difference is (-44.17996795243055, -23.4409801756263).
Hypothesis Testing
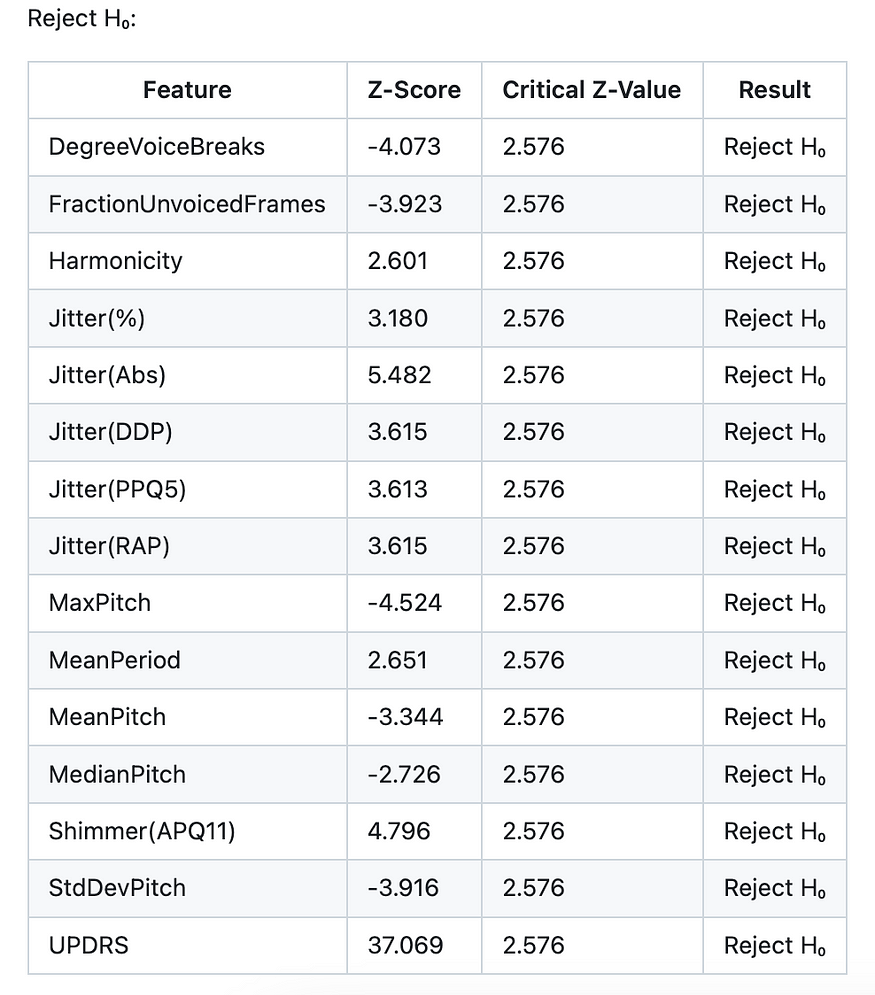
The study compared the acoustic characteristics, pitch-related measurements, and clinical ratings of healthy and ill people. Significant differences were seen in the results across several dimensions. Some traits, however, fell short of necessary z-values, indicating that there isn’t enough support to assert that healthy and sick people differ significantly from one another. Nevertheless, these characteristics aid in developing a comprehensive picture of the contrast between the two groups.

Significant differences between healthy and ill people were demonstrated by characteristics that refuted the null hypothesis (H0). For instance, “FractionUnvoicedFrames” got a z-score of -3.923, whereas “DegreeVoiceBreaks” had a z-score of -4.073. The z-score for traits like “Harmony” was 2.601, highlighting the difference between the two groups. Other measures, such as “Jitter” metrics, “MaxPitch,” “MeanPeriod,” “MeanPitch,” “MedianPitch,” “Shimmer(APQ11),” “StdDevPitch,” and “UPDRS” scores, all displayed z-scores that noticeably exceeded the necessary values, emphasizing the significance of these deviations.
Features Selection
The study employs a combination of hypothesis testing and feature sorting to identify the most crucial traits for detecting Parkinson’s disease (PD). The null hypothesis is tested and recorded in the “reject_results.csv” file, followed by sorting the features with mean differences and confidence intervals. Using NumPy’s np.intersect1d() method, the study identifies features that consistently indicate relevance through hypothesis testing. This strategy simplifies the analytical process by focusing on characteristics that consistently point to significance and distinguishing characteristics.

The feature selection strategy includes DegreeVoiceBreaks, FractionUnvoicedFrames, MaxPitch, MeanPitch, MedianPitch, Shimmer(APQ11), StandardDevPitch, and UPDRS. These features are selected based on their central tendencies like Mean, Median, and SD. StdDevPitch was chosen due to its low confidence interval and its association with differentiating healthy and unhealthy people. UPDRS is chosen for its narrow confidence interval and its high mean differences. FractionUnvoicedFrames and DegreeVoiceBreaks are excluded as they appear similar in the Histogram.
Jitter(%), Jitter(Abs), Jitter(DDP), Jitter(PPQ5), and Jitter(RAP) are identified as interesting features for detecting PD. Jitter(%) is chosen as the next feature due to significant mean differences between Jitter(%) and Jitter(DDP). The choice between Jitter(%) and Jitter(DDP) was based on the Histogram, as it is believed to help detect PD with more certainty.
The project’s analysis and visualizations revealed significant differences in auditory characteristics between those without Parkinson’s disease (PD) and those without it. These results show promise for the development of a non-invasive diagnostic tool for Parkinson’s disease (PD), which may allow for earlier treatments and better patient outcomes.
The final columns after all the analysis are;
- MaxPitch
- StdDevPitch
- UPDRS
- Jitter(%)
- PD indicator
Conclusion
To uncover discrete auditory indications for diagnosing Parkinson’s Disease (PD), we thoroughly analyzed voice sample data using descriptive analysis, inferential statistical tests, and domain expertise. Through careful selection aided by hypothesis testing, mean difference calculations, and feature distribution visualizations, we discovered that MaxPitch, StdDevPitch, UPDRS, Jitter(%), and the PD indicator exhibited consistent significance in differentiating PD-affected individuals from healthy individuals. Our study highlights the promise of speech analysis as a viable technique for detecting Parkinson’s disease (PD) early on, even if additional testing and machine learning models are needed. This option suggests the potential for developing a non-invasive diagnostic instrument.
References
- National Institute of Neurological Disorders and Stroke. (2023). Parkinson’s Disease Information Page. https://www.ninds.nih.gov/healthinformation/disorders/parkinsons-disease
- Parkinson’s Foundation. (2023). Notable Figures. https://www.parkinson.org/understanding-parkinsons/statistics/notable-figures
FOLLOW ME to be part of my Data Analyst Journey on Medium.
Let’s get connected on Twitter or you can Email me for project collaboration, knowledge sharing or guidance.
Join thousands of data leaders on the AI newsletter. Join over 80,000 subscribers and keep up to date with the latest developments in AI. From research to projects and ideas. If you are building an AI startup, an AI-related product, or a service, we invite you to consider becoming a sponsor.
Published via Towards AI
Take our 90+ lesson From Beginner to Advanced LLM Developer Certification: From choosing a project to deploying a working product this is the most comprehensive and practical LLM course out there!
Towards AI has published Building LLMs for Production—our 470+ page guide to mastering LLMs with practical projects and expert insights!

Discover Your Dream AI Career at Towards AI Jobs
Towards AI has built a jobs board tailored specifically to Machine Learning and Data Science Jobs and Skills. Our software searches for live AI jobs each hour, labels and categorises them and makes them easily searchable. Explore over 40,000 live jobs today with Towards AI Jobs!
Note: Content contains the views of the contributing authors and not Towards AI.


