The Data Science Evolution: A Tale of Trends, Talent, and Time!🚀
Author(s): Kashish Rastogi Originally published on Towards AI. The Data Science Evolution: A Tale of Trends, Talent, and Time!🚀 This analysis isn’t a battle of the sexes it’s a deep dive into how men and women engage with different aspects of the …
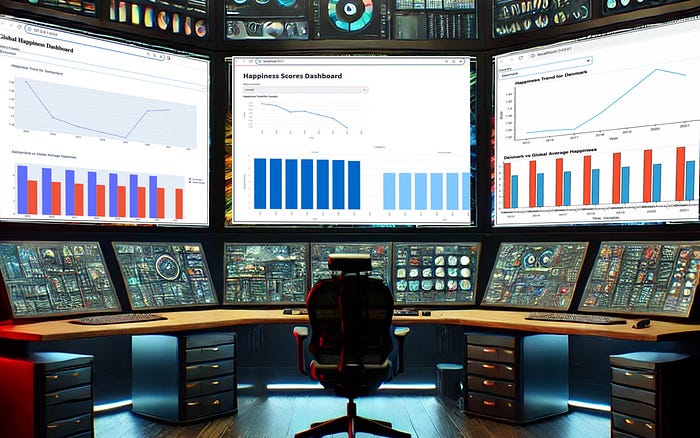
Which Python Dashboard Is Better? Dash, Panel And Streamlit Showdown
Author(s): John Loewen, PhD Originally published on Towards AI. Prompting GPT-4 for multi-visual interactive dashboard creation This member-only story is on us. Upgrade to access all of Medium. As a comp sci professor, over the past year, I have heavily integrated GPT-4o …
Pandemics Simplified: A Toy Model’s Take on COVID-19
Author(s): Maxime Jabarian Originally published on Towards AI. This member-only story is on us. Upgrade to access all of Medium. Source In this post, I’ll take you on a journey into the world of infectious disease modeling, focusing on a visually engaging …
Sturdy GPT-4 Guardrails: Better Prompting For Python Code Results
Author(s): John Loewen, PhD Originally published on Towards AI. Minimizing frustration and inaccuracy in your data viz results This member-only story is on us. Upgrade to access all of Medium. As a Computer Science professor I have been using GPT-4 for well …
GPT-4o Python Charting Insanity: Prompting For Instant Data Visuals
Author(s): John Loewen, PhD Originally published on Towards AI. Hands-on no-code visuals from the UN population projection dataset This member-only story is on us. Upgrade to access all of Medium. The automatic data visualization generation tools for GPT-4o keep getting better and …
Explainable Clustering — The Introduction of Recursive Embedding and Clustering and its Application
Author(s): Yuki Shizuya Originally published on Towards AI. The explainable clustering method overview Recently, I read an interesting article from Spotify titled “Recursive Embedding and Clustering.” According to the blog, Spotify developed an explainable clustering method and utilizes this technique to research …
10 No-Nonsense Machine Learning Tips for Beginners (Using Real-World Datasets)
Author(s): Mukundan Sankar Originally published on Towards AI. Stop Overthinking and Start Building Models with Real-World Datasets This member-only story is on us. Upgrade to access all of Medium. Photo by Mahdis Mousavi on Unsplash Do you want to get into machine …
Is GPT-4 Getting Any Better At Quantitative Image Analysis?
Author(s): John Loewen, PhD Originally published on Towards AI. Can it do decent quantitative analysis from a data visualization? This member-only story is on us. Upgrade to access all of Medium. For me, one of the most useful GPT-4 tools is the …
Simple GPT-4 Prompting For An Awesome Animated Streamlit App
Author(s): John Loewen, PhD Originally published on Towards AI. Visualizing alarming UNHCR displacement trends with Python This member-only story is on us. Upgrade to access all of Medium. Python Streamlit is an awesome framework for creating interactive web interfaces — and GPT-4 …
9 Hidden Plotly Tricks Every Data Scientist Needs to Know
Author(s): Mukundan Sankar Originally published on Towards AI. Why Your Current Visualizations Aren’t Telling the Full Story This member-only story is on us. Upgrade to access all of Medium. Photo by Firmbee.com on Unsplash When it comes to data visualization, Plotly is …
What’s Really Driving the 2024 Election Narrative?
Author(s): Mukundan Sankar Originally published on Towards AI. An Inside Look at Media Sentiment and Key Issues Using Data This member-only story is on us. Upgrade to access all of Medium. Photo by visuals on Unsplash At the time of this writing, …
How to Conduct Descriptive Statistics Analysis Effectively
Author(s): Richard Warepam Originally published on Towards AI. Breaking Down Descriptive Statistics: How to Squeeze More Insights from Your Data This member-only story is on us. Upgrade to access all of Medium. Photo by Justin Morgan on Unsplash First things first. I’m …
What Can GPT-4 Do Now With Data Visualization Report Generation?
Author(s): John Loewen, PhD Originally published on Towards AI. The state of affairs with automatic data visualization reporting This member-only story is on us. Upgrade to access all of Medium. GPT-4, as a powerful language model, can analyze data, generate visualizations, and …
Why scikit-learn isn’t the Best for Visualizing Decision Trees: Meet dtreeviz
Author(s): Souradip Pal Originally published on Towards AI. Fall in Love with Decision Trees with dtreeviz’s Visualization This member-only story is on us. Upgrade to access all of Medium. Decision Trees, also known as CART (Classification and Regression Trees), are undoubtedly one …
Better GPT-4 Prompting For Interactive Python Plotly GIS Maps
Author(s): John Loewen, PhD Originally published on Towards AI. Mapping historical shipwreck data from Harvard data set There are some terrific sources for data sets out there on the internet, including historical shipwreck data. One of the weekly updates I receive as …


