


Comprehensive Data Analysis with SQL and Data Visualization: Alibaba User’s Behavior Investigation
Last Updated on January 17, 2023 by Editorial Team
Author(s): Kirsten Jiayi Pan
Originally published on Towards AI.
As data analysts, we all know that a beautiful dashboard can tell stories of the dataset, and meaningful business insights can turn data into dollars. So how to exploit the limited data and help businesses to achieve their goals?
This article will teach you how to manipulate data with SQL (Structured Query Language) and excavate meaningful business insights from the data you receive like a professional data analyst. You can learn simple data ETL, metrics design, data analysis, generating business insights, and data visualization to achieve business goals from the full life cycle of data analysis project.
To be more descriptive, I will create a user behavior report with you based on users’ orders from Alibaba between November 25th, 2017, and December 3rd, 2017, on the Alibaba platform. There are around 1 million customer activities in our dataset.
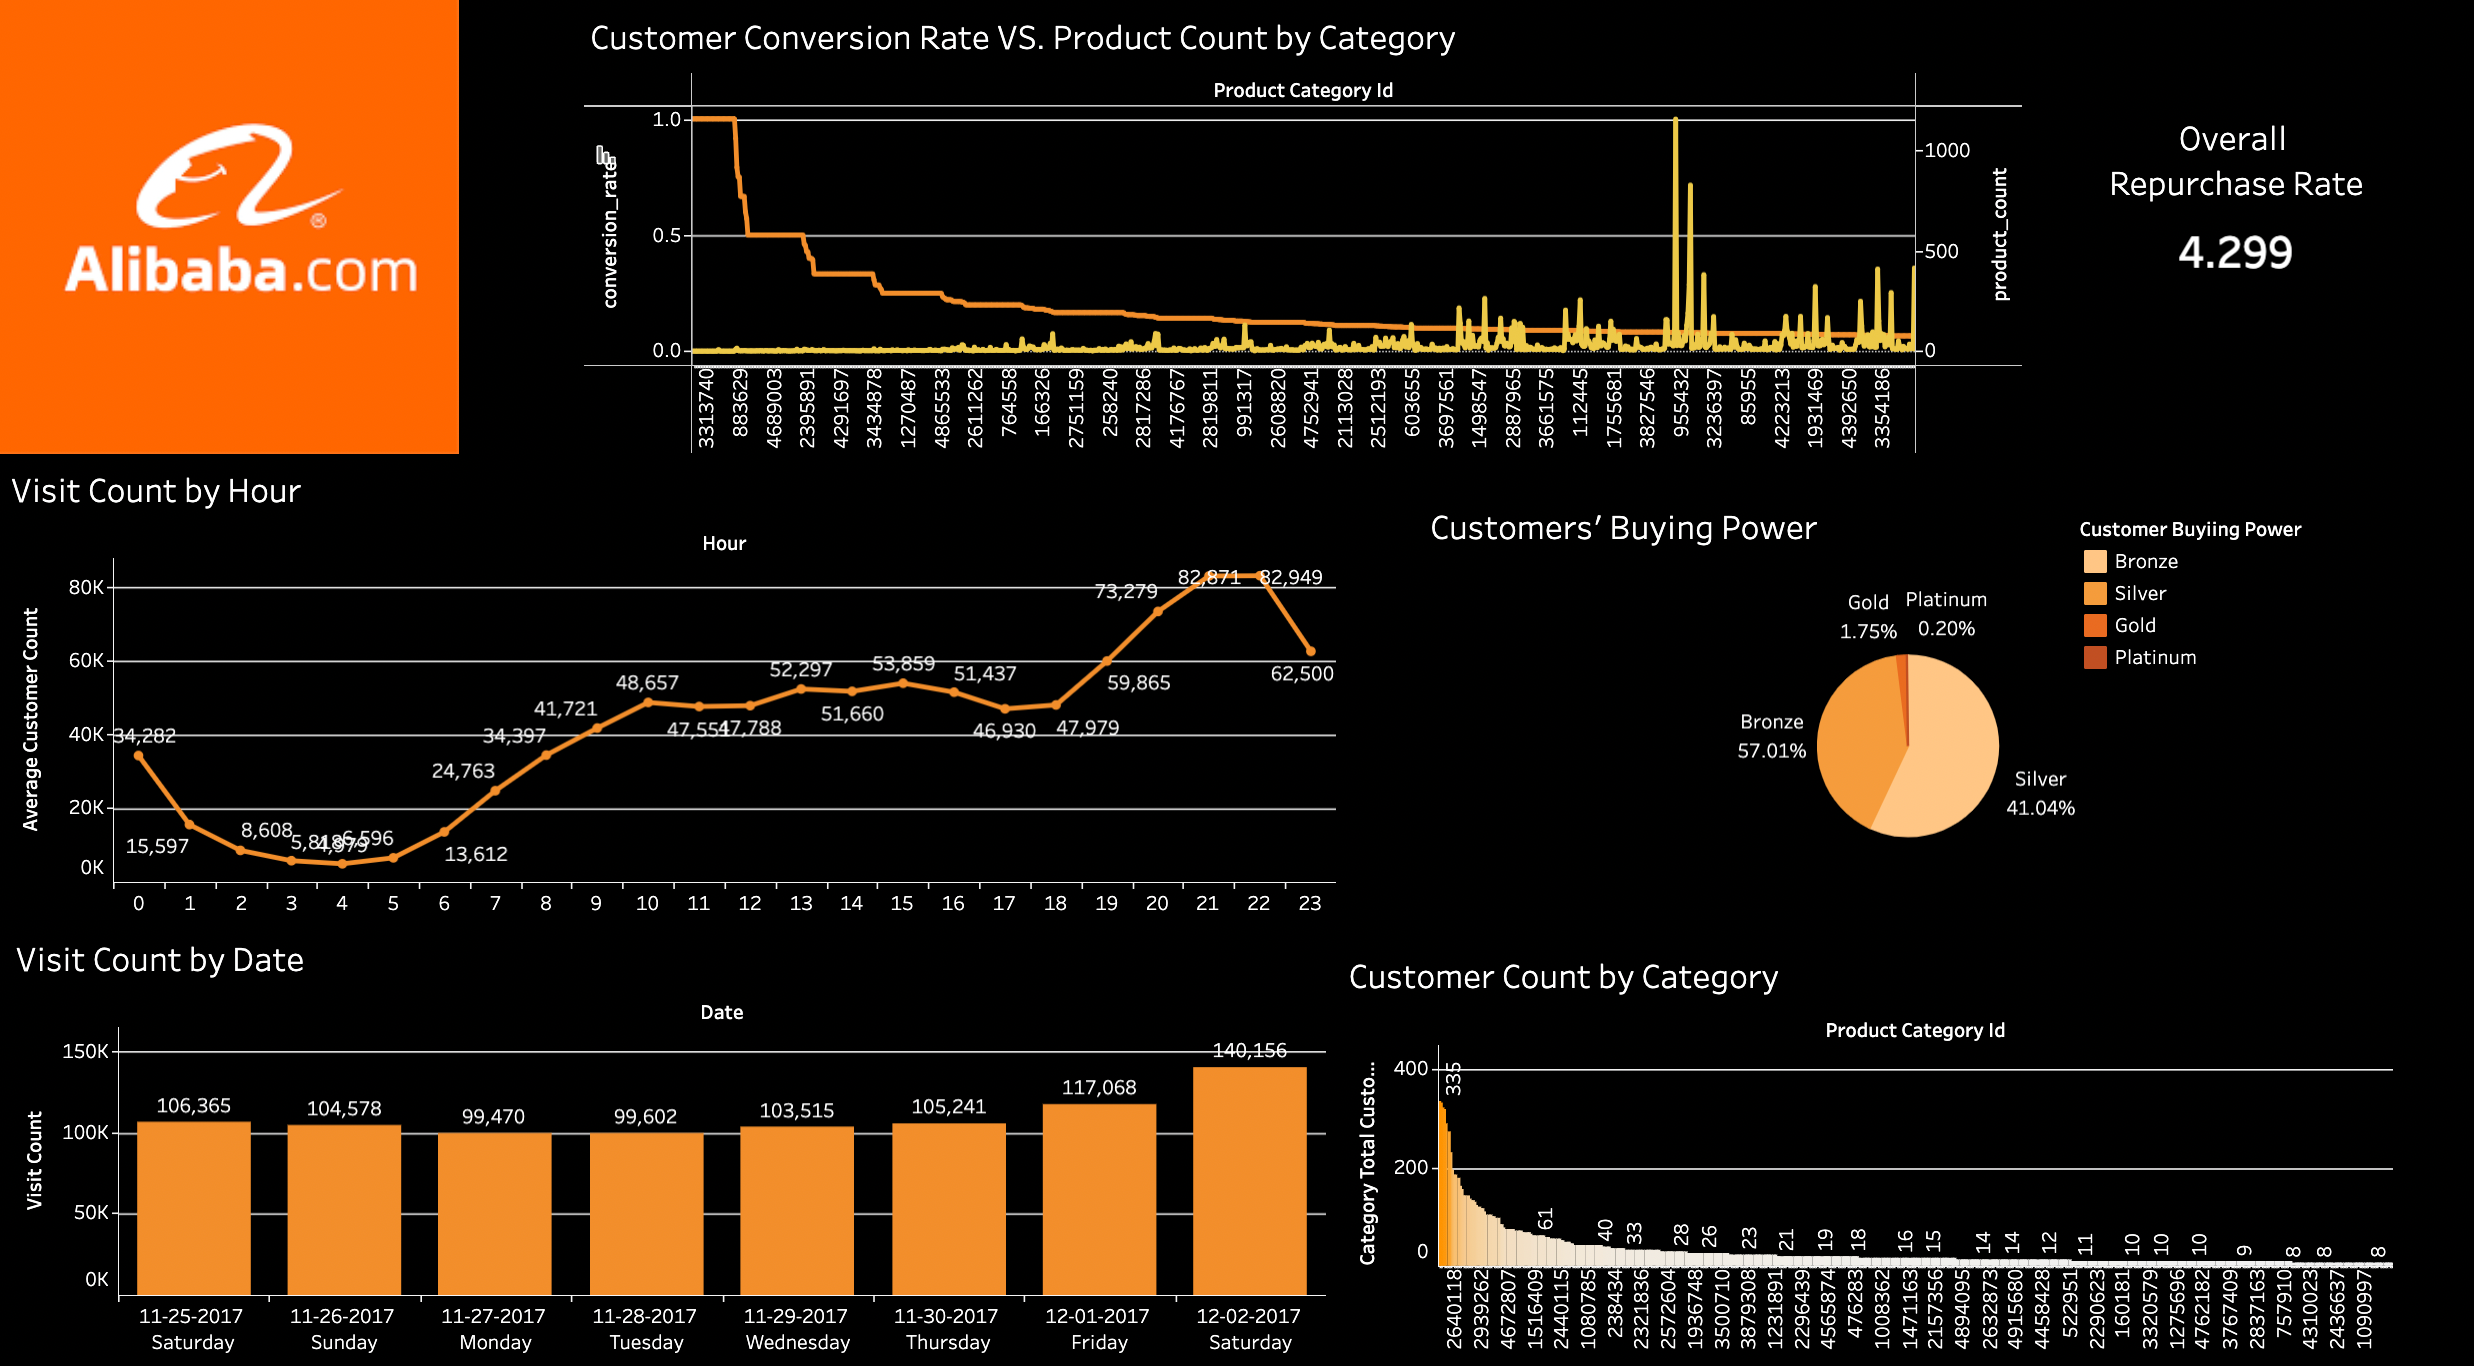
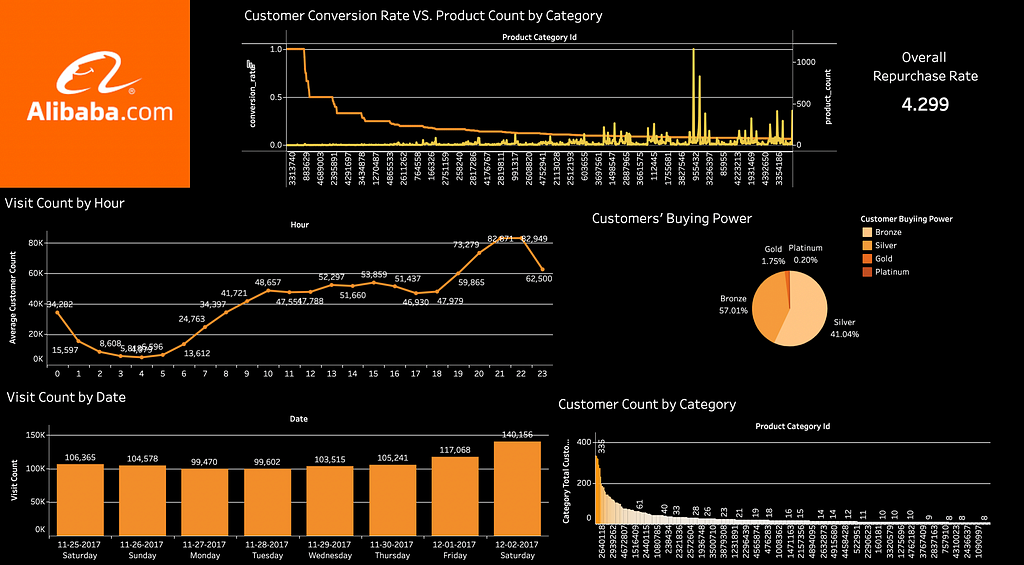
The image below is a preview of the Alibaba user behavior dashboard:
Now, let us start our full life cycle of data analysis…
We only have one table for analysis. The table has one million rows (events) and five columns originally (excluding the column id that we created as the primary key). Here is a brief description of our table:
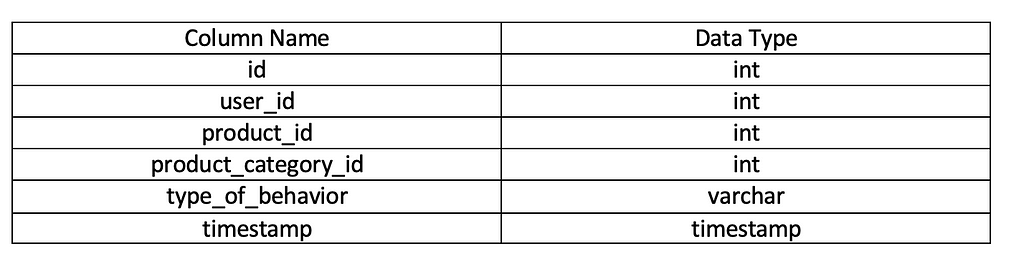
· id is the primary key column for this table. Since the original dataset doesn’t have a primary key, so we have to generate an auto-increment primary key for the table.
· user_id is the id for each user.
· product_id is the id for each product.
· product_category_id is the id for each product category
· type_of_behavior describes users’ actions, which include “pv”, “buy”, “cart”, and “fav”
· timestamp describes the timestamp of each event
Step 1: Create Table ALI_USER_STAGE and ALI_USER in MySQL Database:
Notes: Why is a staging table necessary in data ETL? A Data Warehouse, Data Staging Area, serves the dual functions of storing unprocessed data from Source Systems and providing storage for temporary tables produced during the transformation process. In other words, all the information needed to update or insert into the target database is stored in the staging table (a temporary table) before inserting into the data warehouse.
CREATE TABLE 'ALI_USER_STAGE" (
"user_id' numeric,
"product_id" numeric,
"product_category_id" numeric,
"type_of_behavior" varchar(255)
"timestamp" numeric)
CREATE TABLE 'ALI_USER' (
"id" int NOT NULL AUTO INCREMENT,
"user_id" numeric,
"product_id" numeric,
"product_category_id" numeric,
"type_of_behavior" varchar(255),
"timestamp" datetime,
PRIMARY KEY ("id"))
Step 2: After importing data to ALI_USER_STAGE in MySQL Database, insert data into ALI_USER:
INSERT INTO ALI_USER(user_id, product_id, product_category_id, type_of_behavior, timestamp)

SELECT user_id, product_id, product_category_id, type_of_behavior, FROM_UNIXTIME(timestamp, ‘Y-%m-%d %H:%m:%S’)
FROM_ALI_USER_STAGE
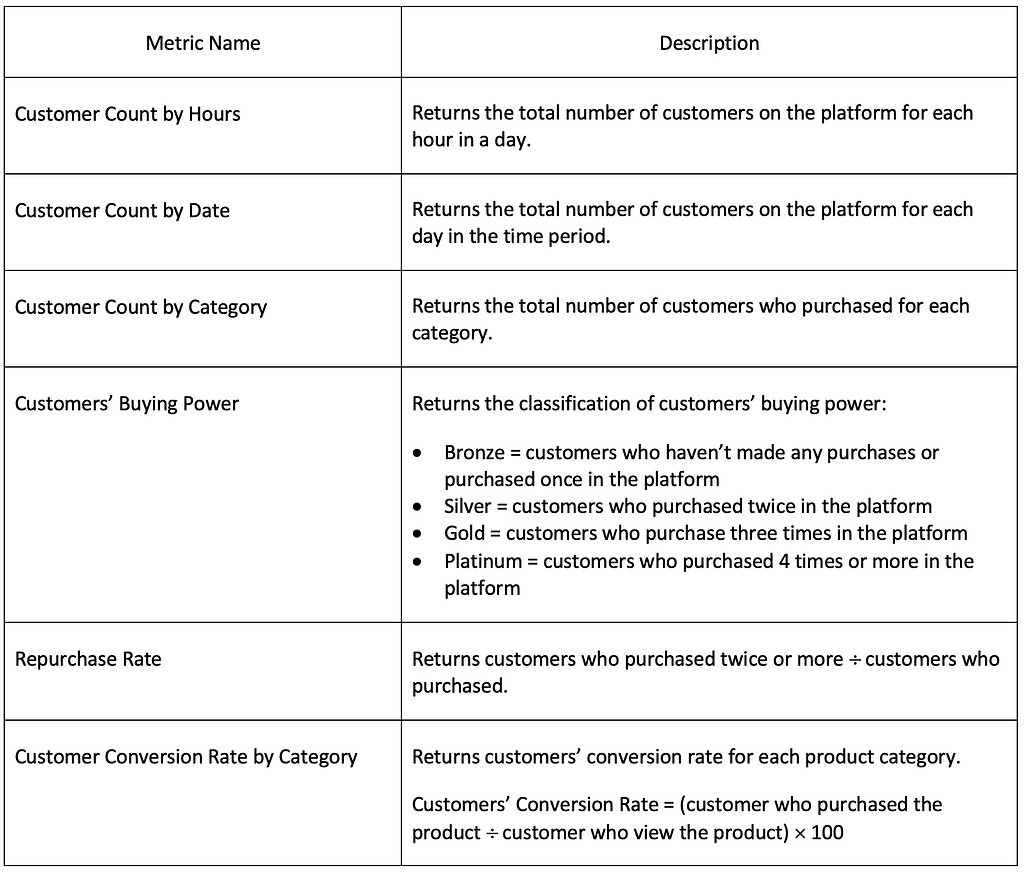
Step 3: Metrics Design
Step 4: Data Analysis
Hypothesis №1: Customers tend to be more active outside of their working hours (in the data source's local timezone)
SELECT HOUR(timestamp) AS hour, COUNT (user_id) AS hourly_total_customer
FROM ALI_USER
GROUP BY hour
ORDER BY hour
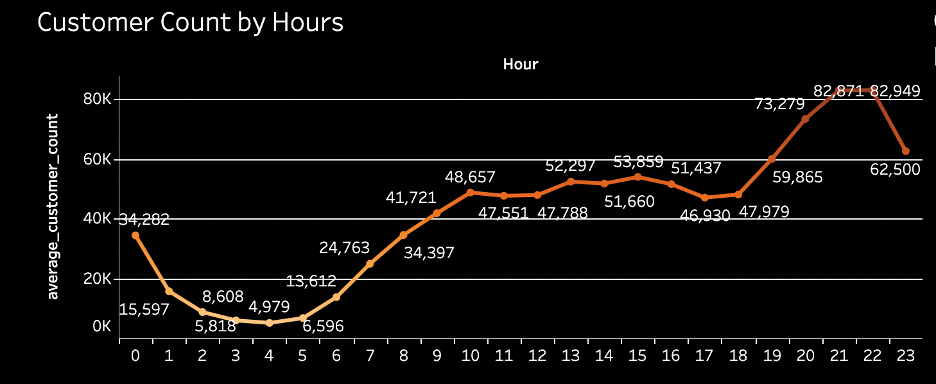
Based on the Customer Count by Hours metric, the peak of the number of customers visiting the platform is between 8 pm to 10 pm in a day, and the lowest is during midnight, which is around 2 am to 5 am. It is obvious that customers tend to visit the platform outside their working hours, and 8 pm to 10 pm is the time that customers have more free time to focus on shopping online. For this reason, Alibaba should target its marketing campaign at the right time because the time customers spend on the platform is precious.
Hypothesis №2: Customers tend to spend more time on the platform during the weekend
SELECT DATE_FORMAT(timestamp, "%m-%d-%Y %W") AS date, COUNT(*) AS visit_count
FROM ALI_USER
WHERE timestamp BETWEEN '2017-11-24' AND '2017-12-03'
GROUP BY date
ORDER BY visit_count DESC
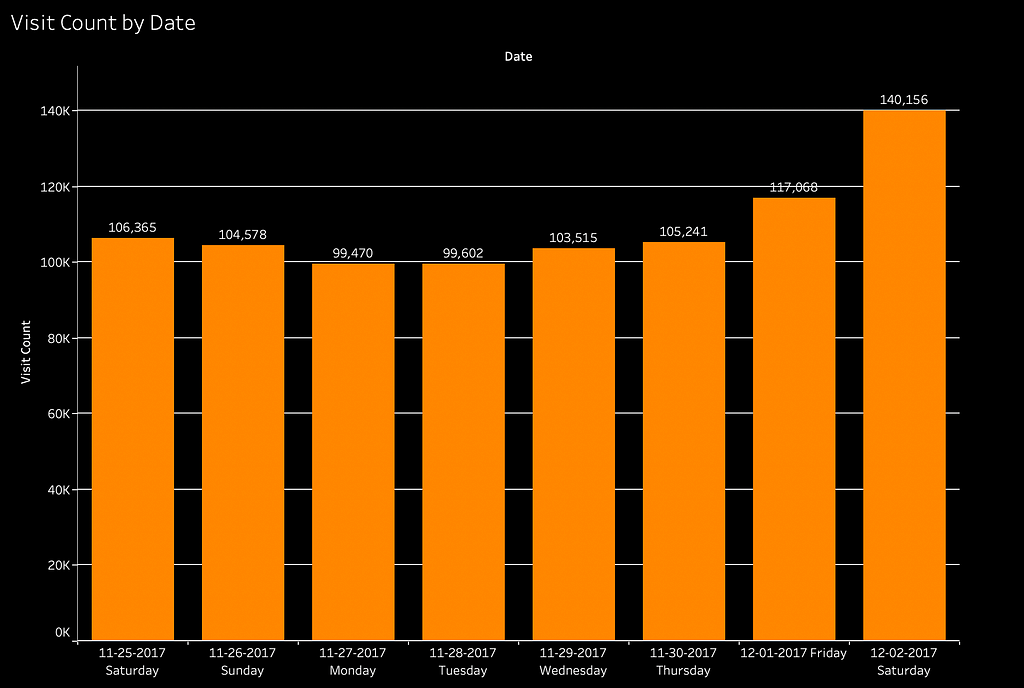
From the Tableau area above, there is an increasing trend in visit counts starting from December 1st, 2017. This is because the coming Alibaba sitewide discount “12/12” (December 12th, 2017) activate many silent customers. Before December 2nd, 2017, the trend of the whole graph presents flatly, and we can conclude that customers are not spending a lot more time on the platform during the weekend regularly. Thus, our hypothesis is not accepted.
Customer Count by Category:
SELECT product_category_id, COUNT(user_id) AS category_total_customer
FROM ALI_USER
WHERE type_of_behavior = "buy"
GROUP BY product_category_id
ORDER BY category_total_customer DESC
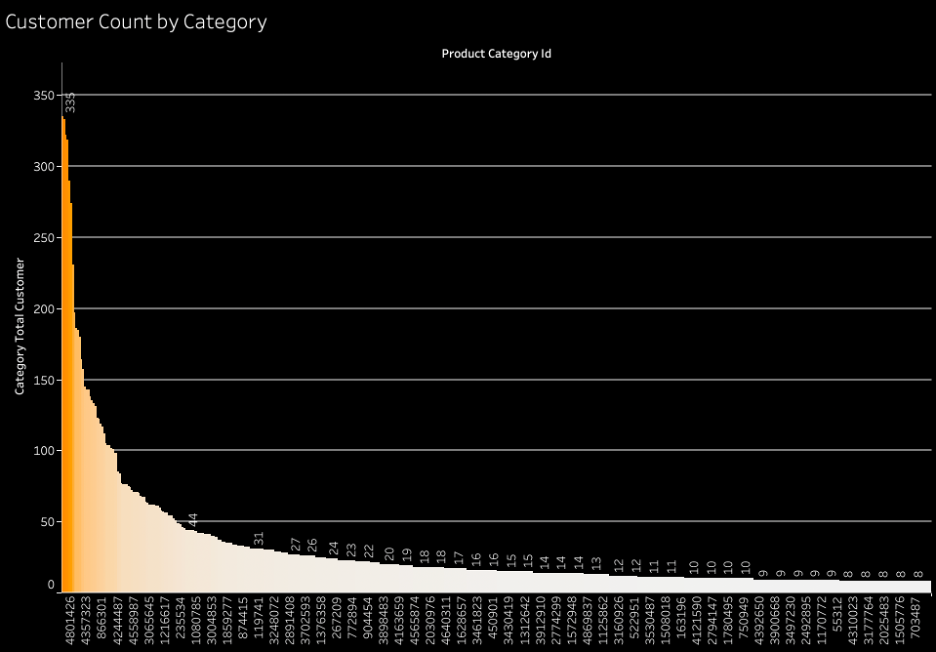
product_category_id = 4801426 has the most purchases, while 181182, 194104, 245030, and 344221 have the least purchases.
Customers’ Buying Power:
SELECT user_id,
 CASE
  WHEN customer_count = 1 OR customer_count = 0 THEN "Bronze"
  WHEN customer_count = 2 THEN "Silver"
  WHEN customer_count = 3 THEN "Gold"
  ELSE "Platinum"
 END AS customer_buying_power
FROM(
 SELECT user_id, COUNT(user_id) AS customer_count
 FROM ALI_USER
 WHERE type_of_behavior = "buy"
 GROUP BY user_id
 ORDER BY customer_count DESC) t
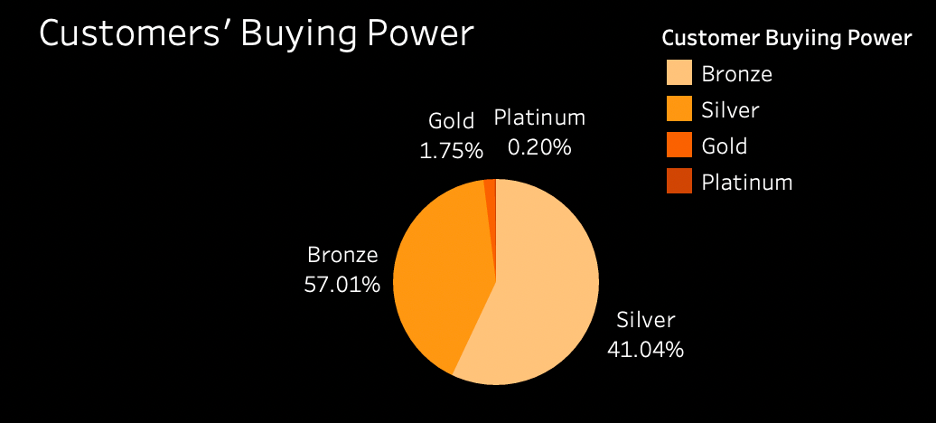
Notes:
· Bronze = customers who haven’t made any purchases or purchased once in the platform
· Silver = customers who purchased twice in the platform
· Gold = customers who purchase three times in the platform
· Platinum = customers who purchased 4 times or more in the platform
According to the list of classified customers generated from the query and the pie chart above, most users had made purchases at least twice between November 25th, 2017 to December 3rd, 2017, from Alibaba. In this case, further recommendations encourage the customers on the “Bronze” list and maintain the rest of the customers by keeping up their purchasing desire.
Repurchase Rate:
WITH cte AS (
   SELECT user_id
  FROM ALI_USER
  WHERE type_of_behavior = "buy")

SELECT COUNT(t.user_id) / COUNT(cte.user_id) * 100 AS repurchase_rate
FROM(
    SELECT user_id
    FROM ALI_USER
    WHERE type_of_behavior = "buy"
    GROUP BY user_id
    HAVING COUNT(user_id) >= 2) t
RIGHT JOIN cte
USING(user_id)
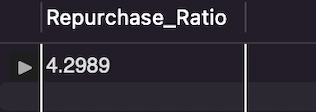
The repurchase rate (customers who purchased at least twice/customer who purchased) is 4.2989%.
Customer Conversion Rate by Category:
SELECT product_category_id, ctvisit, ctbuy,concat(round(ctbuy*100/ctvisit,3),'%') AS conversion_rate, product_number
FROM
  (SELECT product_category_id,count(*)as ctvisit,
      SUM(CASE WHEN type_of_behavior='buy' then 1 else 0 end) as ctbuy,
      COUNT(DISTINCT product_id) as product_number
   FROM ALI_USER
   GROUP BY product_category_id) t
ORDER BY conversion_rate
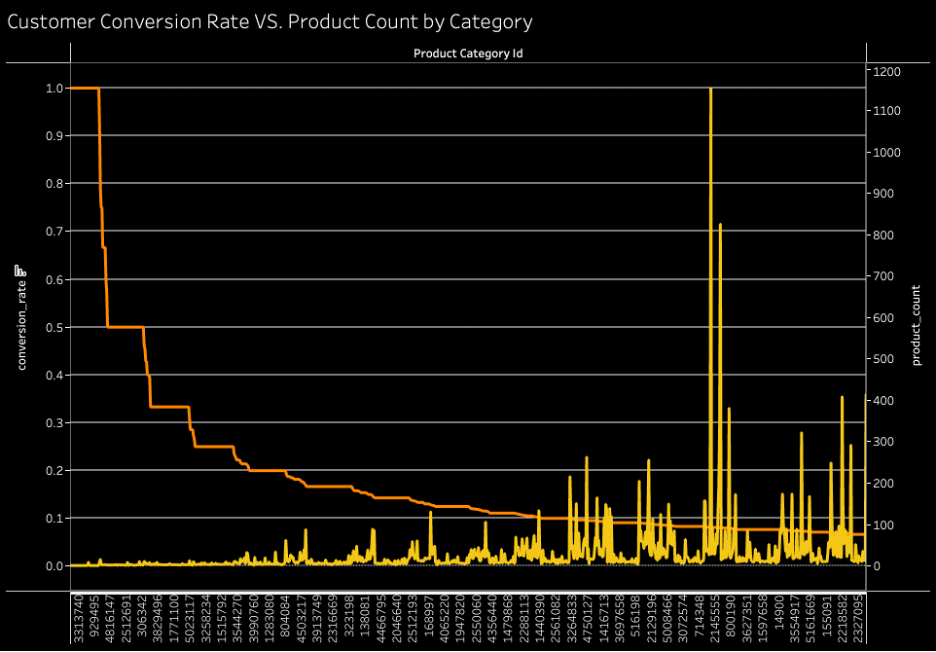
There are a couple of product categories that have high conversion rates, which show in the graph above. To investigate the reason behind the fact, we drilled down to the detail by adding the number of products in each category in our graph. The graph shows that the higher the customer conversion rate, the lower the number of products in the category. This is because when customers have too many options or substitution, they might need to take more time to compare products, which lead to a lower customer conversion rate. On the other hand, for the product category with fewer options or substitutions, customers tend to spend less time choosing the product, leading to a higher customer conversion rate. To summarize, the product categories with the most purchases are ranked by the combination of customer conversion rates and page visits.
Reference: https://beeketing.com/blog/connection-customer-choice-conversion/
Step 5: Conclusion and Recommendations
- Most customers are active on the Alibaba planform around 8 pm to 10 pm; we recommend that the Alibaba marketing department enhance the marketing campaign from 8 pm to 10 pm by focusing on suggested product push.
- Since the number of customers who were active during the weekend is very similar to other dates regularly, we don’t suggest the platform needs to spend extra effort on the marketing campaign for the weekend. However, the marketing department should be aware of the coming visiting peak for Alibaba sitewide discount “12/12”.
- A few product categories have low purchase rates, like 181182, 194104, 245030, and 344221. We suggest the marketing department increase product exposure for these categories to their target customers and be prepared for Alibaba sitewide discount “12/12”.
- By analyzing the customers’ buying power, most customers are in the “Bronze” and “Silver” levels. In this case, we recommend that the marketing department analyze customers’ shopping carts and enhance the recommended product algorithm to improve the purchase rate of customers.
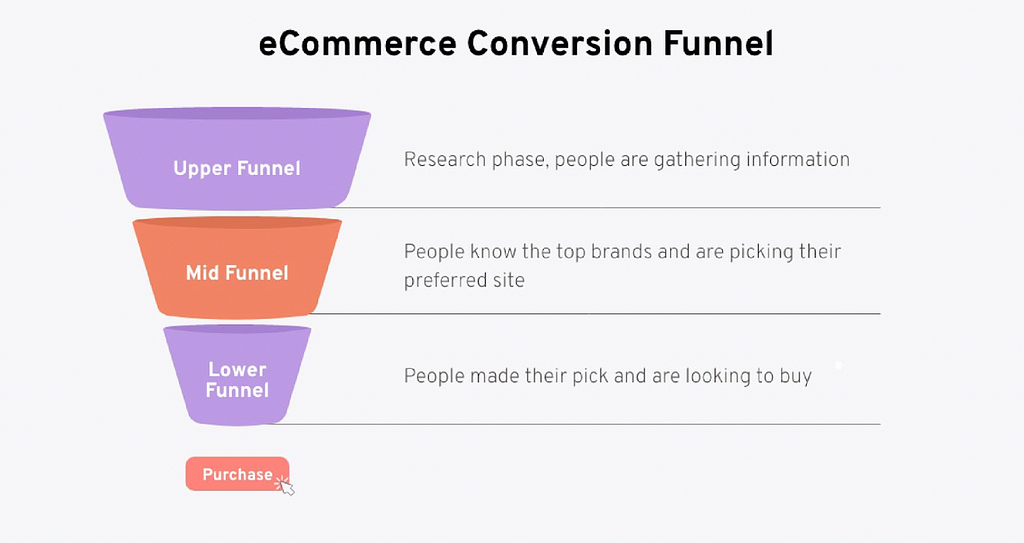
- Most businesses that fall in the low customer conversion rate product categories are in competitive market. After digging into the “eCommerce Conversion Funnel,” we discovered that customers prefer to choose among the top brands when they have too many choices. Such a competitive market is unfriendly for small businesses in the same product category. In this case, we encourage small businesses to break through from their original product category and cover the product categories with high customer conversion rates by using some of their products.
Step 6: Data Visualization
Tableau Dashboard: https://public.tableau.com/app/profile/jiayi.pan4997/viz/alibaba_user_analysis/Dashboard1?publish=yes
Comprehensive Data Analysis with SQL and Data Visualization: Alibaba User’s Behavior Investigation was originally published in Towards AI on Medium, where people are continuing the conversation by highlighting and responding to this story.
Join thousands of data leaders on the AI newsletter. Join over 80,000 subscribers and keep up to date with the latest developments in AI. From research to projects and ideas. If you are building an AI startup, an AI-related product, or a service, we invite you to consider becoming a sponsor.
Published via Towards AI
Towards AI Academy
We Build Enterprise-Grade AI. We'll Teach You to Master It Too.
15 engineers. 100,000+ students. Towards AI Academy teaches what actually survives production.
Start free — no commitment:
→ 6-Day Agentic AI Engineering Email Guide — one practical lesson per day
→ Agents Architecture Cheatsheet — 3 years of architecture decisions in 6 pages
Our courses:
→ AI Engineering Certification — 90+ lessons from project selection to deployed product. The most comprehensive practical LLM course out there.
→ Agent Engineering Course — Hands on with production agent architectures, memory, routing, and eval frameworks — built from real enterprise engagements.
→ AI for Work — Understand, evaluate, and apply AI for complex work tasks.
Note: Article content contains the views of the contributing authors and not Towards AI.
Related posts
Recent Posts


")

