


How to Extract and Visualize YouTube Data in Tableau Using Google Sheets and Apps Script
Last Updated on January 6, 2023 by Editorial Team
Last Updated on December 1, 2021 by Editorial Team
Author(s): Warrie Usenobong Warrie
Originally published on Towards AI the World’s Leading AI and Technology News and Media Company. If you are building an AI-related product or service, we invite you to consider becoming an AI sponsor. At Towards AI, we help scale AI and technology startups. Let us help you unleash your technology to the masses.
Data Visualization
Digital data gathering is fun, how about data collection on what you watch and enjoy?
Imagine a scenario where you want to keep track of details about your favorite YouTube channel. These details could include the number of subscribers, views, and the most recent video date. Taking things a step further, you likely might want to save these details somewhere handy, presumably in a simple text file, and you’d like them updated at certain intervals.
So how do you go about this in a simple way?
In this article, you will learn how to use Google Apps Script to extract data from YouTube Channels into Google Sheets, then use Tableau to display this data.
Background
Google App Script
Google App Scripts is a low-code cloud services platform that allows users to effortlessly extend the functionality of Google’s products and also allows interaction across these platforms, without requiring extensive knowledge in the software development process. App Script uses popular programming languages such as JavaScript, HTML, and CSS to build services.
There are other extended functionalities of the app script, but our focus will be on the use of app scripts to programmatically interact with Google Sheets as a means to automate data entry from YouTube.
Tableau
Most data analysts would have probably heard of Tableau, a visual interactive platform with an excellent and mind-blowing community. In this post, we’ll use Tableau Public, a free platform that allows you to publish data visualization online. Tableau will be utilized to visualize our final data by connecting to the Google Sheets connector on its platform.
Let’s get started, but first with what you need to know.
Pre-requisite
- A Google account to access Google Sheets and Apps Script.
- A Tableau public account and Software, if you do not already have one.
- Beginners’ knowledge of JavaScript is fine.
- Google Cloud Platform account.
Now that you have knowledge of what is required, let’s get started on the actionable steps.
Compile a List of YouTube Channel IDs
Before you start building, you need to have a list of Youtube channel IDs. This ID is unique to a channel and will be used to extract the channel’s detail from the API.
To do this, you must manually populate the list of your favorite channels in a new Google sheet. This information does not have to contain the actual name of the channel. The essence of populating these names is to have a high-level view of the target YouTube channels; then, for each name, search for their respective url_id.
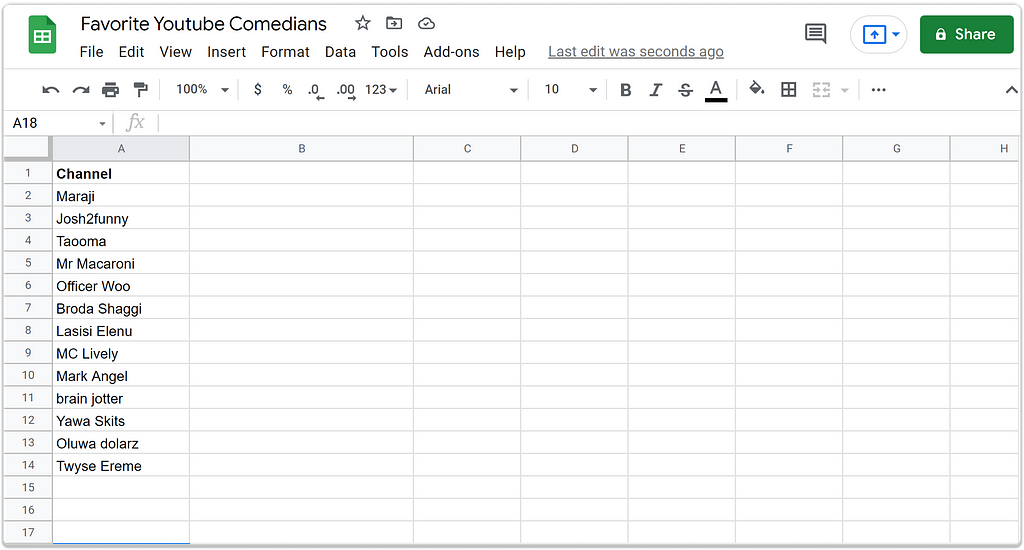
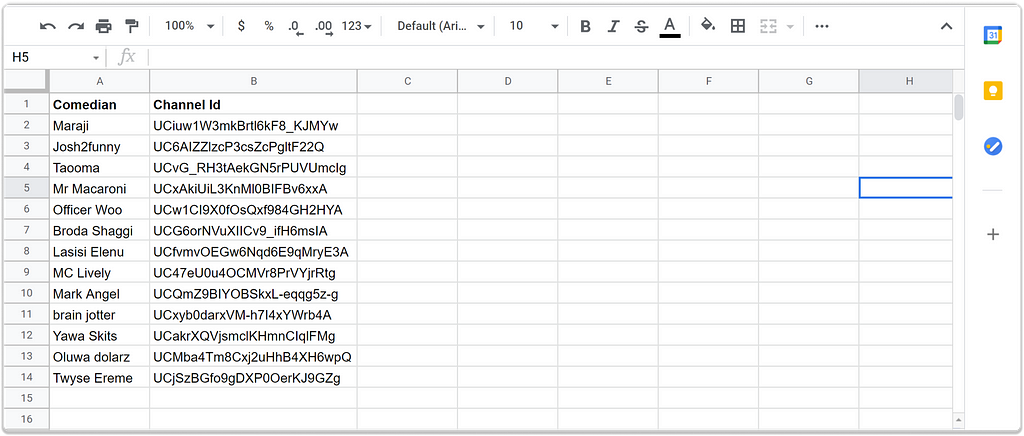
Create a new google sheet with the name “Favorite Youtube Comedians”
Get Channel ID
This section deals with getting the unique ID associated with the account. Each channel has a unique ID found in its URL.
On YouTube, search for the populated channel name, click on the channel name in one of the returned video lists and copy the ID from the URL (https://www.youtube.com/channel/UCfvmvOEGw6Nqd6E9qMryE3A).
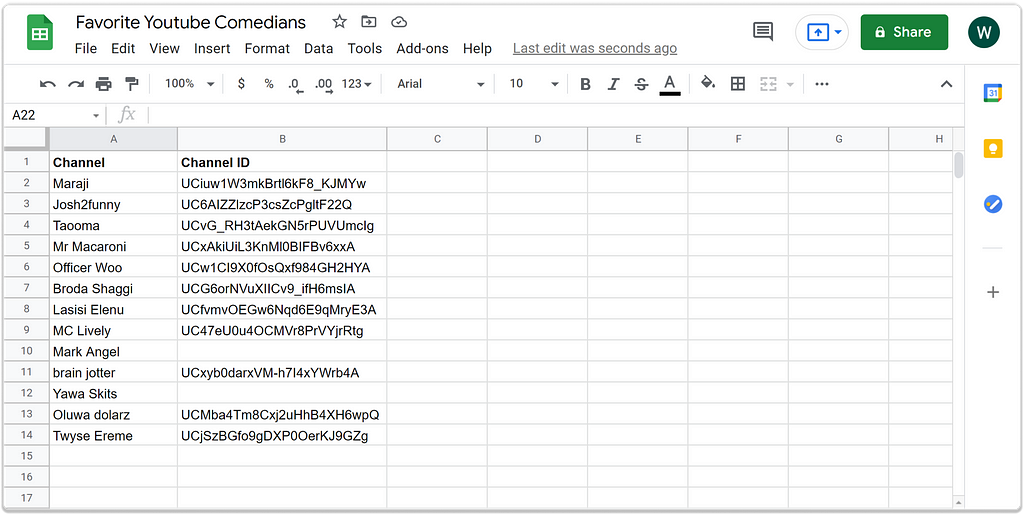
After that, create a new column — Channel ID– and paste the ID under the column in the cell associated with the channel’s row. Ensure that this is done for each channel.
Contrariwise, you’ll notice that some URLs are different from the conventional ID-based URL. These channels’ URLs use youtube-legacy usernames and do not expose their IDs in the URL; as such, extracting the channel’s ID will require a different technique.

To resolve this issue, you’ll utilize Youtube Data API;
- Copy the channel’s username from the URL. For example, in the URL- https://www.youtube.com/user/MarkAngelComedy, the username is MarkAngelComedy.
- Navigate to Youtube API in your browser to retrieve the channel ID from YouTube API explorer. Make sure you’re already signed in using your Google account.
- Click list (by YouTube username) on the API web page.
- Replace GoogleDevelopers with the channel’s username in the forUsername textbox located in the right panel titled “Try this API”.
After that, click on the EXECUTE button at the bottom of the panel. This action will require you to authenticate your Google account and grant access to YouTube API. Once access is granted, the API’s response will be displayed, as shown above, from which you can get the channel ID under the JSON value id > items.
For subsequent channels under this scenario, you just have to replace the username in forUsername textbox and then run EXECUTE command, after which you can copy the ID and paste it into your google sheet.
Certainly, at the completion of this process, you now have the entire list of channel IDs in a column.
Google AppScript Setup
Step 1: Access Google App Script
Now that you have all the channel IDs in the spreadsheet, you will have to access the apps script bounded to google sheet. This editor will foster data interaction between Youtube and the sheet.
- Click on the Extension>Apps Script editor in the sheet’s menu bar. This action will create a new script project and instantiate a file, code.gs on the app script editor interface. The interface looks like the regular code editor, but this time around, it runs on a cloud platform and is instantiated from google sheet. You can also write code in a function and store it in a separate file name.
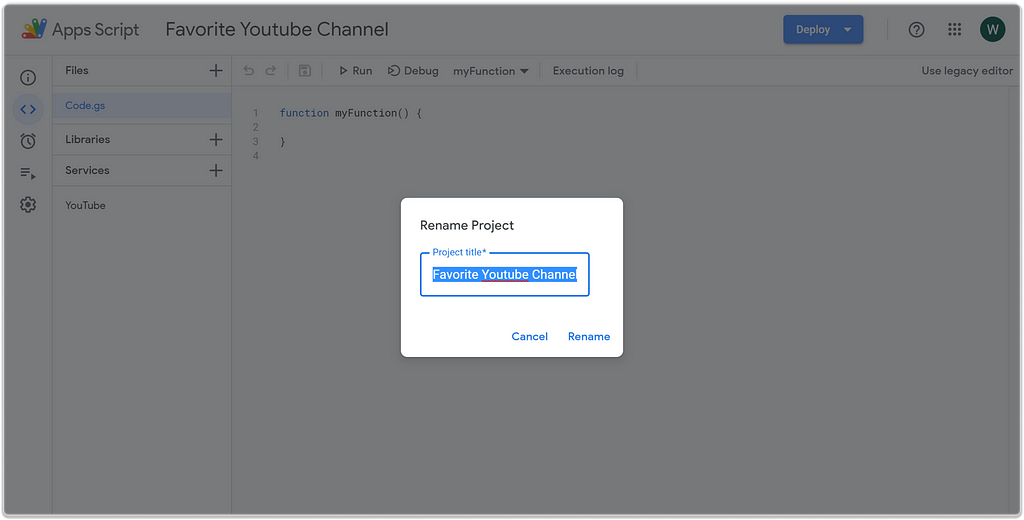
- Rename your Project Name. At the top left of the script editor, change it from “Untitled Project” to “ Favorite Youtube Channels”
Step 2: Setup Youtube Service
Apps script provides built-in google services, so since you need details from YouTube channels you will need the YouTube Data API service to pull data into the sheet.
To enable this YouTube service in Apps Script;
- Click on the Services < > in the left panel.
- Select YouTube Data API v3 and click Add.
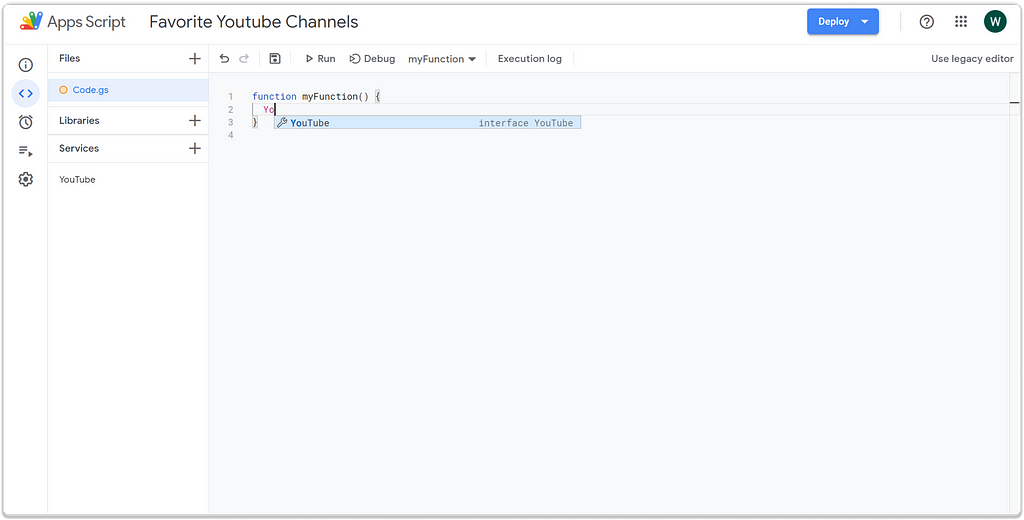
Once that has been done, you now have access to the Youtube data service as shown in the interface above. In the next section, you will go through the process of using this interface in extracting data from Youtube API into the sheet.
Data Extraction
Upon completing the setup in the previous section, you are set to write codes in javascript that will retrieve details from the YouTube channel.
In this article, you will extract the following channel details:
- Title
- Published Date
- Number of Subscribers
- View Count: Total number of views accumulated
- Video Count: Total number of videos uploaded.
- Video Uploaded Playlist Id
- Last Upload Date
- Highest-Viewed Video Title
- View Count of Highest-Viewed Video
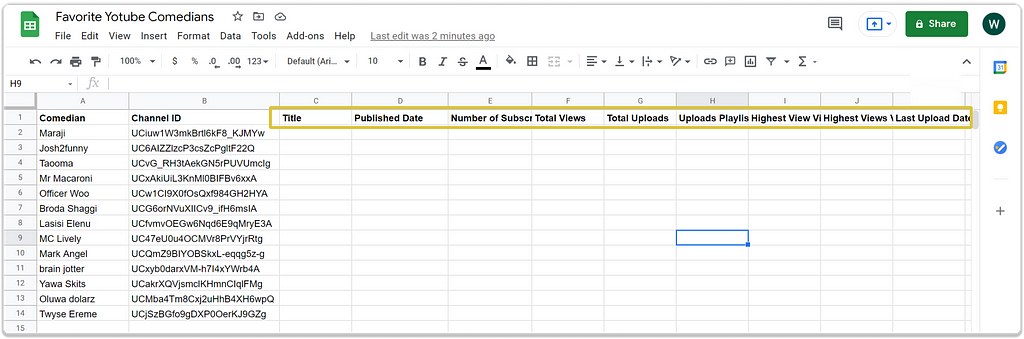
In order to achieve these items, you have to conduct the following cause of action. But first, create 9 headers specifying the column of the details that you will extract into the sheet.
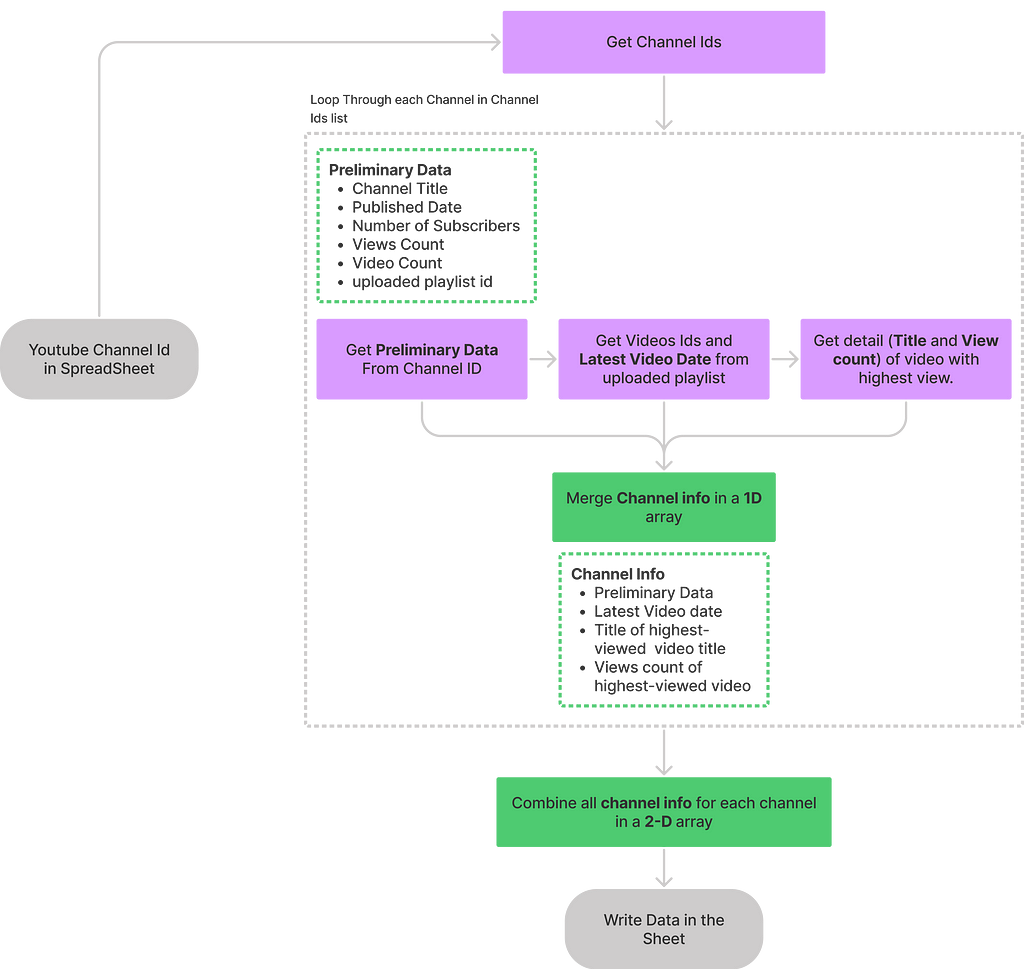
Here is an overview of how extracting these details will follow;
- Read Channel IDs from the Sheet.
- Extract Data from Youtube API using IDs.
- Write Data into the Sheet.
A detailed explanation of the functions and it’s execution will be explained subsequently.
Read Channel IDs from the Sheet

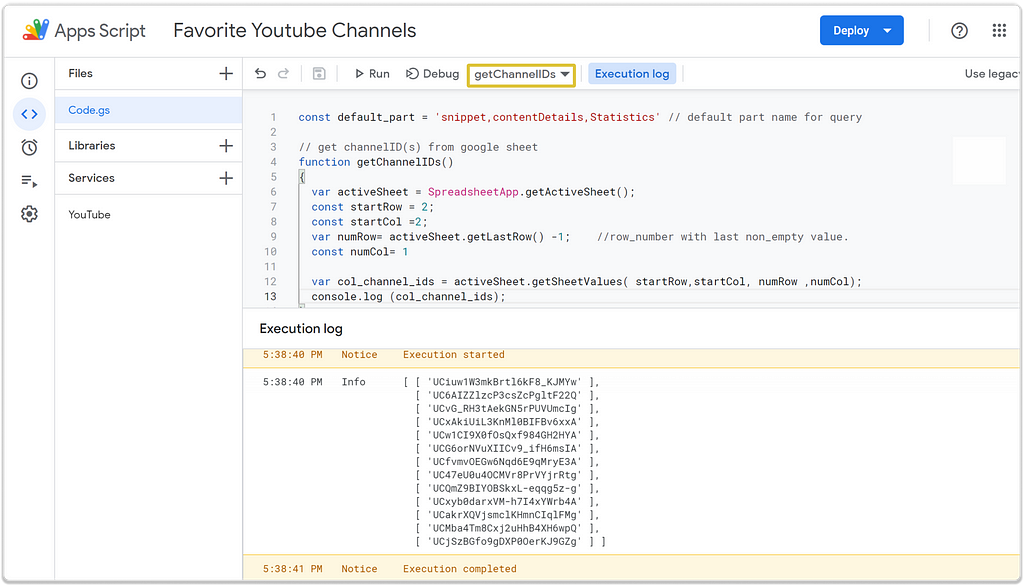
In this section, you’ll need to build a function getChannelID(). This function retrieves the IDs from the sheet into the Apps Script. Note that the IDs will be used to retrieve the channel’s details.
In the editor, replace function myFunction(){} with the code below:
Later, we will explain the function of each code. For the time being,
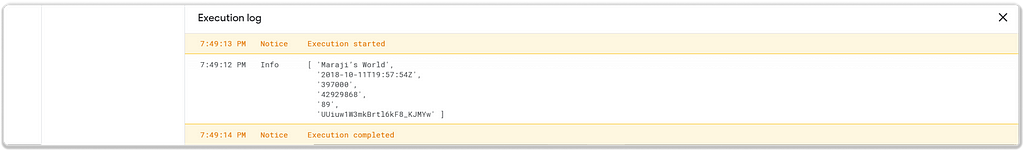
Save the script and click on the Run button on the menu bar. This will redirect you to a page to authenticate your Google account and grant the script information access to your google account. Once you have accepted the process, the result of your action will be shown below.
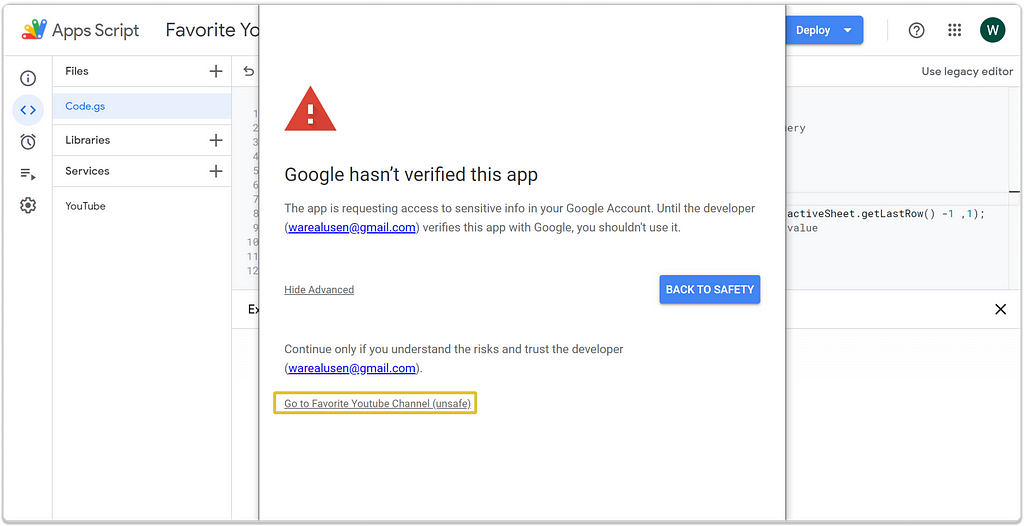
In the response prompt, you do not have to panic about security since the script was created by you. But be careful when accessing scripts you have no knowledge about.
To continue, click on the Go to Favorite Youtube Channel (unsafe)
Once the authentication of your account is completed, you can now re-run the function in the editor.
Back to explaining the code snippet.
In this snippet, we instantiated the class SpreadsheetApp.getActiveSpreadsheet() from the Spreadsheet service– an inbuilt Google Library that will allow access and manipulation of our current spreadsheet. In our case, the worksheet is Sheet1, and the spreadsheet is Favourite YouTube Comedians. — Don’t confuse the difference between a spreadsheet and a worksheet.
After that, we accessed the range where the channel IDs are located on the sheet using the method getSheetValues() that takes in 4 parameters (startRow,startCol,numRow,numCol), describing the range of value to be retrieved.
The result of this function is all the channel IDs in a 2-dimensional array.
You can replace the return col_channel_idsfunction with console.log(col_channel_ids) to print out the results of the data in a 2-dimensional array.
To run the code select the function name at the menu bar and click the run button.
Get Data from Channel ID
Now that we have access to the channel’s ID on the app script, the next action has to do with querying the Youtube Library so as to get the first set of details –Title, Published date, View Count: Total number of views accumulated, Video Count: Total number of videos uploadedand, Video Uploaded Playlist Id– which will be obtained from the channels.list() method in YouTube service
First, create a function called getDataFromChannelID() and include the code snippet below;
From the code snippet, this function takes in 2 input arguments, part and channelID, and returns specific details about the channel. It uses Youtube.Channels.list() method to get the channel’s data.
In lines 18-25; Since the response from the API comes in the form of a JSON, we index the part parameters specified in the input to get our response of interest. The part parameter signifies the category of information required to be returned from the API. In this scenario, we need information nested under snippets, statistics, and contentDetails in the API. The output is an array of all the preliminary data details.
Retrieve Video Details
The next set of information required from the channel has to do with the video details: Last Upload Date, Highest-Viewed Video Title , and Number of views for the highest-viewed video.
To get this information, you will go through the process of accessing all the videos in a channel using the video IDs through which the video details will be retrieved.
On the app script and the code part, this will involve the following steps:
- Get the playlist ID associated with video uploads in a channel.
- Retrieve all uploaded video IDs and Last Upload Date using the playlist ID.
- Retrieve the highest viewed video details using video IDs.
Retrieve all Uploaded Video IDs and Last Upload Date
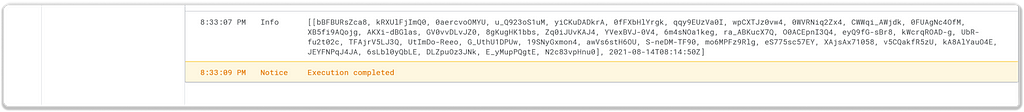
The uploaded playlist ID has been retrieved in the previous section, so you will use this value to get the IDs of all the videos uploaded and the last upload date in each channel. The function is implemented in the code snippet below.
From above, the function takes in the uploaded playlist id as an input parameter. More on the code is explained below;
In the body, the function queries the method Youtube.PlayListItems.list() and loops through the list of videos in the channel’s uploaded playlist using the while statement and only stops when there is no more page to query from the method, which is tracked with the variable nextPageToken.
Inside the iterations, it first logs the Last Upload Date which is located at the top of the query result in the first page.
Afterward, in line 27, due to the fact that the method Youtube.PlayListItems.list() returns a list of videos content page by page, we employ the map function to extract content from each page and then index into the response in line 28, to get the video IDs which are later appended to an array.
The final result is an array containing a list of all video IDs and the Last Upload Date.
Retrieve the Highest-Viewed Video Details using Video IDs
Having gotten the video IDs in the previous section, you will calculate the remaining video details — Highest-Viewed Video Title and Number of views for the highest-viewed videoin this section.
Create a function getHighestViewedFromID().
This function takes in a list of video IDs, loops through 50 IDs at a time, and retrieves their video details. The essence of 50 retrievals per call is to reduce the number of queries to the API.
Here is the gist. We are trying to retrieve the view counts for each video using the service API method YouTube.Videos.list(). Each query into the API costs 1 unit. However, the cost of hitting the API once for a single video detail is the same cost for several video details. As such, we are retrieving video details in batches for an optimal unit charge.
And even with this multiple-retrieval capability, the maximum number of videos allowed for retrieval is 50 per call. This calls for the need to split the list of video IDs and retrieve their details in batches of 50 for a single query instance.
Still, inside the iteration, line 23, you can see that we got our information of interest by indexing the title in the snippet part of the response and viewCount in the statistics part of the response; representing the video name and the number of times the video has been watched.
With this now, to get the most-watched video details; the array is sorted in descending order by the number of views, as shown in line 28, and the first element is popped-out. The first element in this scenario is an array consisting of the highest-viewed video and its views counts.
Upon completing this action, you have now retrieved all the data needed. The next point of call will require writing this data to the sheet.
Write Data to Sheet
This is the last helper function that will store our data into the Google sheet. Pushing the data to the sheet will require the utilization of the Spreadsheet library method getActiveSpreadsheet(). As shown in the snippet,
The function takes in the final result: a 2-D array of values. It stores the data in the sheet utilizing the getRange() function which takes in 4 parameters, where the 3rd signifies the number of rows which is the number of channels, and the 4th specifies the length of an item in the 2-D array- number of columns/channel details.
Put Everything Together
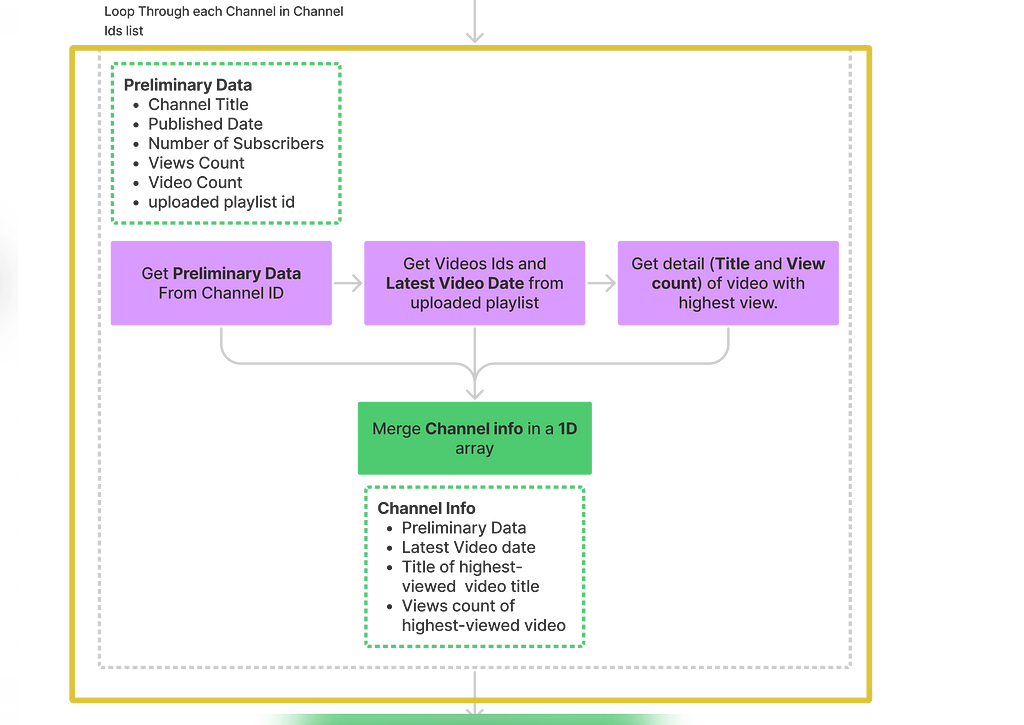
Now that all our pipeline and helper functions are ready, we can now put everything together. The previous sections had involved dealing with the helper functions for a single channel. You’ll incorporate things into dealing with multiple channels, like in our use-case of multiple comedy channels.
We will employ the use of a function called executeAll(). It starts with retrieving all the channel IDs from the spreadsheet in the form of a 2-D array, using the method getChannelIDs() created in the previous section. We iterate through the list of IDs using the map function. With the map function, we can call each item in the array just once and process it to return new values in a 2-D array.
The first action inside the recursive function returns preliminary data from the channel ID which are (Title, Published date, Number of subscribers, number of views, number of videos and, uploaded playlistID).
Still, inside the loop, the next action, in line 7 extracts the uploaded playlist ID from the preliminary data and passes it into a variable, uploaded_playlist_id. Then we retrieve the list of video IDs and latest-upload date using uploaded_playlist_id as an input parameter into the method getUploadedVideoIDs_LastDt().
The next action uses the video IDs in the method getHighestViewedFromID() to get the details of the highest viewed video in each channel.
After which all the desired data are coupled together in a 2-D array, and the function returns data consisting of preliminary data,latest-upload date, highest_viewed_video_title and highest_viewed_video_count.
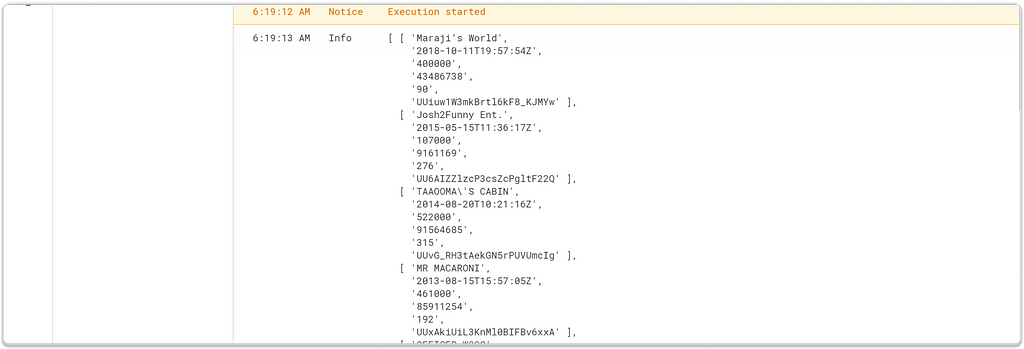
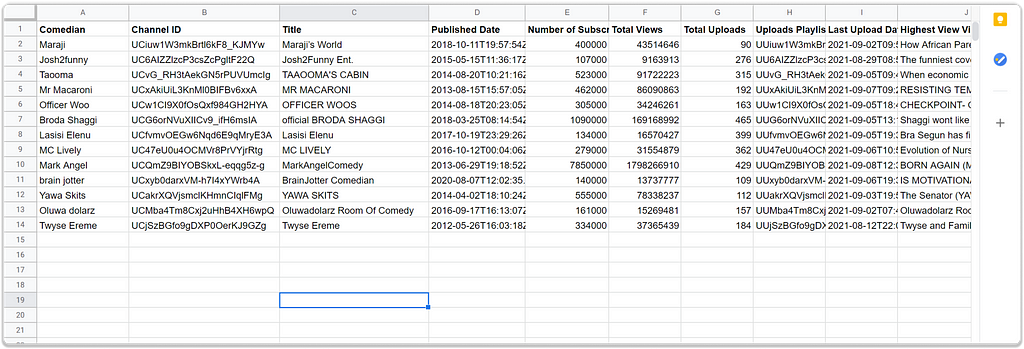
Finally, the data containing each channel’s detail in a 2-D array is then written to the spreadsheet.
Remember to create a column header in the following order: Title, Published Date, Number of Subscribers, Total Views, Total Uploads, Uploads Playlist Id, Last Upload Date, Highest Viewed Video, and Highest Viewed Video Count.
Automate the Data Pull
You now have our data in a google sheet. The next point of call for us will involve triggering an update of this data at a specific time period which will be done with the time-driven trigger in Apps Script.
Time-Triggers are reserved functions that fire an event at a specific period. The event, in this context, is updating the data on the sheet; you’ll want this event to be done at a regular interval of 12 hours.
On the app script page, click on the Triggers button on the left panel as shown in the image below.
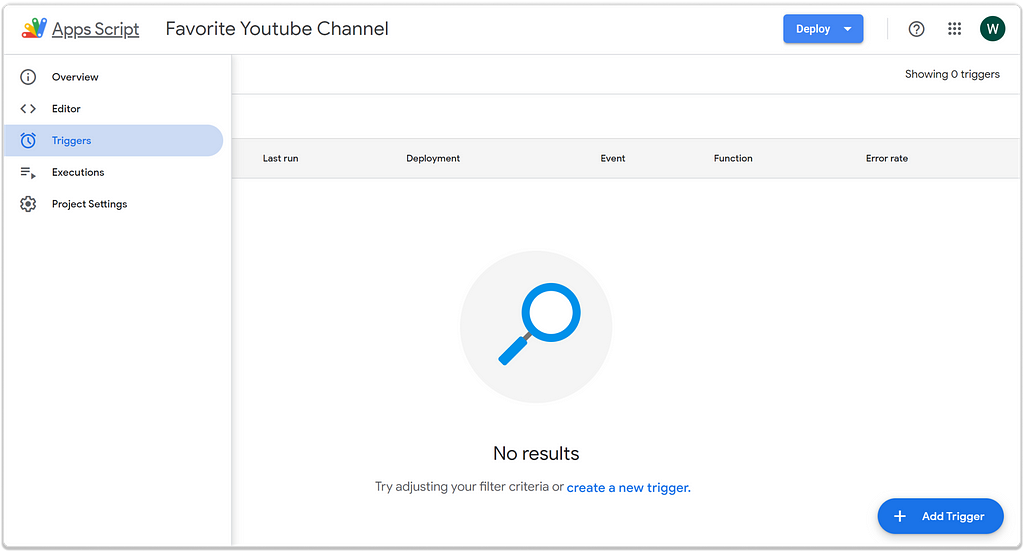
Completing this setup will involve the following steps:
- Click on the button Add Trigger. This action will open the prompt page, so we can then fill those values based on the trigger.
- Under the text “choose which function to run”, select the executeAll() function; which contains all the algorithms required to pull data from the sheet; other functions are helper-functions that aided the main process.
- Select Time-Driven on the select event resource,
- Choose hour timer under Select type of time-based trigger. Then select Hour interval as every 12 hours.
Finally set the Failure notifiction settings to Notify me immediately. This will send a notification message immediately there is an issue with your code. Note that this message will be sent to the email attributed to your google account.
Then click on the Save button.
Once this is saved, the trigger will start executing every 12 hours starting from the current saved time. In some cases, it starts reading from 12am.
Optionally, you can create a customized time-driven trigger, programmatically, for unavailable trigger intervals on the prompt page.
Data Visualisation
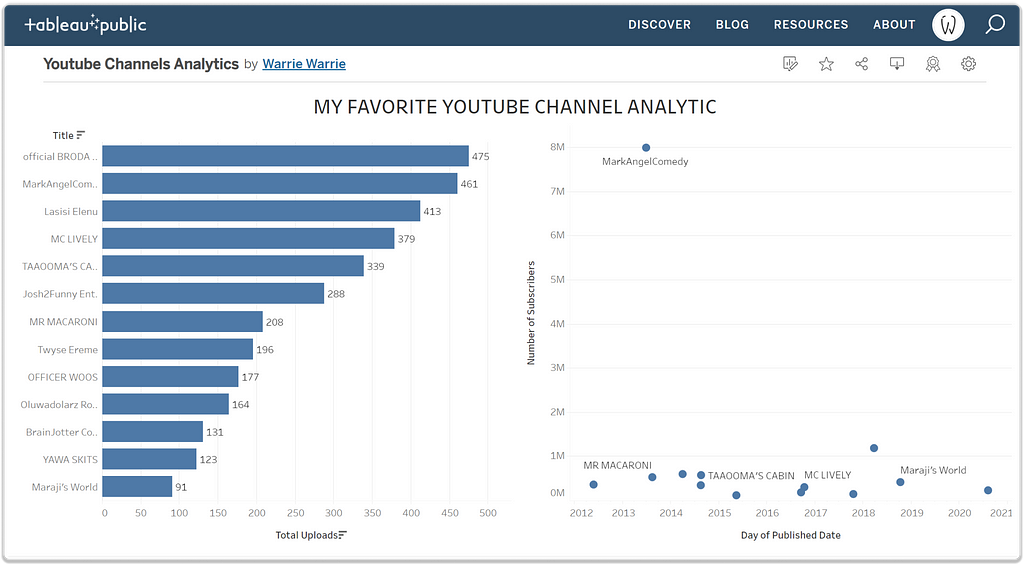
The final section is to create a simple visualization of our data in Tableau. In this presentation stage, you will connect your data in Google Sheets to Tableau and create a simple bar chart showing the channels with the highest number of video uploads; and a scattered plot between number of subscribers vs published date.
So here is what we will be doing to achieve this.
Connect Data to Tableau Public
On Tableau public, click on “google sheet connector”
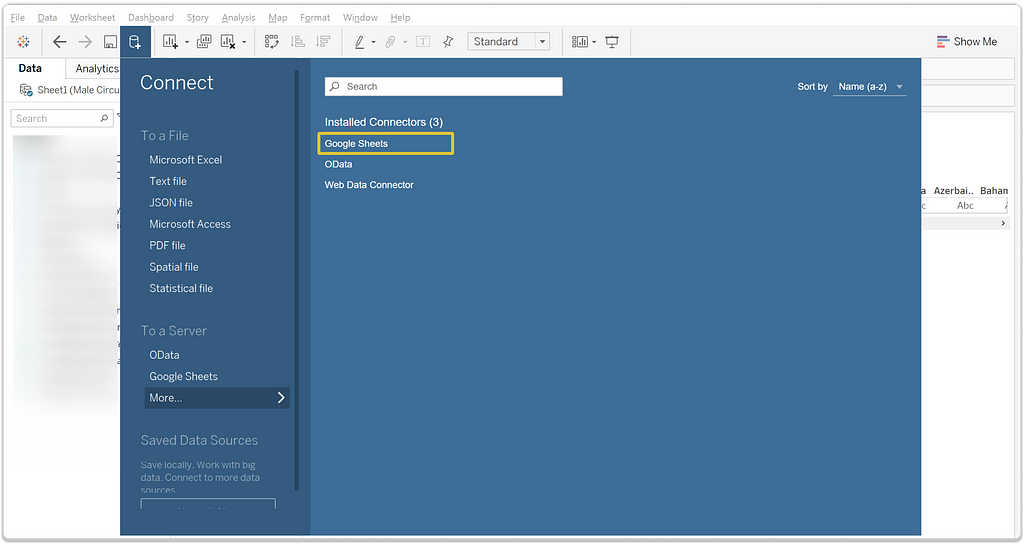
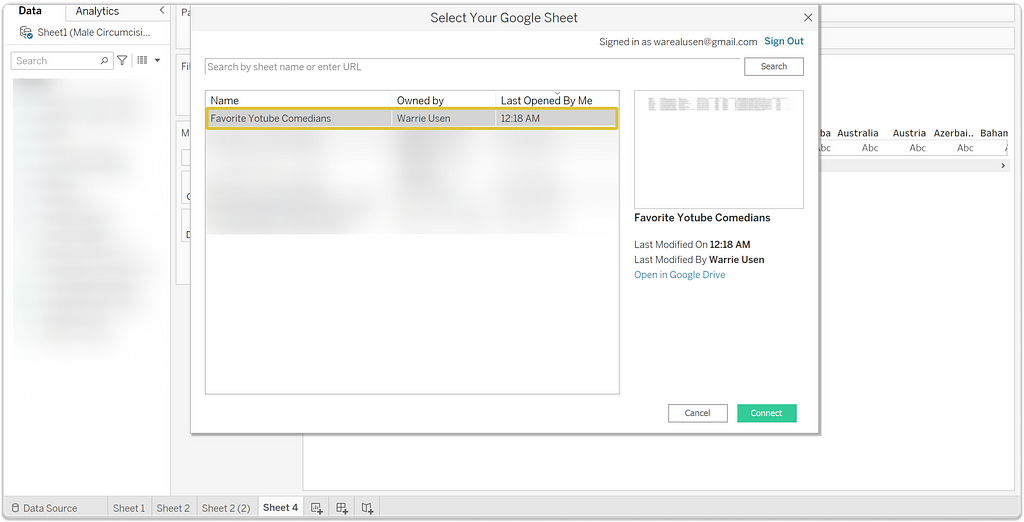
Tableau will request access to your Google Sheets in your browser, so click on your respective account and access it. Once that is done, you will see a screen informing you of the successful access.
You can safely close and go back to your tableau public.
On the screen, you will see a list of google sheets, choose the one that was created for this work. Then click on Sheet 1 on the tab below to start visualizing.
Prep Data
Note that on the left panel, you will observe the icon Abc close to the variable name Last upload Date and Published Date in the Table panel. This signifies that Tableau wrongly detected these date-time variables as text, so we will have to convert them to a date-time datatype.
To do that, we will take the following steps:
- Select Last Upload Date and Published date.
- Right-click and select Change Datatype > Date & Time.
The date-time columns are now successfully in their appropriate data type.
Variable Visualising and Formatting
At this stage, you will create a graphical representation of each variable. Starting with a simple bar chart for the number of video uploads. To do this;
- Drag the Total Uploads in the left panel into “Columns” and Title into “Rows”.
- Again, drag Total Uploads to Label in the card, Marks
To explore further, you can create a scatter plot showing the relationship between the Published date and the Number of subscribers.
First, Open a New Worksheet; drag the Published date and Number of subscribers to the Columns and Rows shelves respectively.
By default, Tableau aggregates the Data & Time variable to Year. So you’ll need to aggregate published date by day since we want to see the relationship on a unique date.
Next, right-click on Published date in the Columns shelf and click on select Day as shown in the image below.
On the Mark Card, select the Circle afterward drag the Title variable to Label. This will show the channel name attributed to each circle in the chart.
Dashboard Creation
Now take it a little further to create a dashboard containing the two built charts.
Click on the Dashboard>New Dashboard, on the menu bar.
Then drag the bar chart sheet to the right panel of the dashboard and the scatter panel to the left.
Then select the Size to be automatic.
To add a title, right-click on the Dashboard in the menu bar at the top and select show title. From there, you can delete the title and rename it based on your preferred title name. In this sample, we used “My Favorite Youtube Comedy Analytic”.
Once you are done, hit Ctrl + S to save the analytics on Tableau public. Ensure you tick the action button, “keep my data in sync with Google sheet and embed my credential.” Then click the save button.
You can now view your favorite YouTuber's analytics visuals.
However, this does not end here as you can try other types of analytics based on the data available; such as keeping track of the last upload date or analyzing the video with the highest views.
PARTING WORDS…
Congratulations, you now have data from your favorite YouTube channels that can be viewed, tracked, and analyzed on Tableau by leveraging apps script.
You can utilize this idea in tracking other aspects of your favorite youtube channels. And also create a better and more beautiful visualization of the data in Tableau. The data used in this tutorial can be found here and the code here.
Thank you! 👋
Reference
- https://developers.google.com/apps-script/advanced/youtube
- Javascript library: https://developer.mozilla.org/en-US/docs/Web/JavaScript/Reference/Global_Objects/Array/map
- Map reference: https://developers.google.com/apps-script/guides/sheets/functions#optimization
- https://developers.google.com/apps-script/guides/services/authorization
- https://developers.google.com/apps-script/guides/triggers/events
How to Extract and Visualize YouTube Data in Tableau Using Google Sheets and Apps Script was originally published in Towards AI on Medium, where people are continuing the conversation by highlighting and responding to this story.
Join thousands of data leaders on the AI newsletter. It’s free, we don’t spam, and we never share your email address. Keep up to date with the latest work in AI. From research to projects and ideas. If you are building an AI startup, an AI-related product, or a service, we invite you to consider becoming a sponsor.
Published via Towards AI
Towards AI Academy
We Build Enterprise-Grade AI. We'll Teach You to Master It Too.
15 engineers. 100,000+ students. Towards AI Academy teaches what actually survives production.
Start free — no commitment:
→ 6-Day Agentic AI Engineering Email Guide — one practical lesson per day
→ Agents Architecture Cheatsheet — 3 years of architecture decisions in 6 pages
Our courses:
→ AI Engineering Certification — 90+ lessons from project selection to deployed product. The most comprehensive practical LLM course out there.
→ Agent Engineering Course — Hands on with production agent architectures, memory, routing, and eval frameworks — built from real enterprise engagements.
→ AI for Work — Understand, evaluate, and apply AI for complex work tasks.
Note: Article content contains the views of the contributing authors and not Towards AI.
Related posts
Recent Posts


")

