


Hands-on Python Debugging using Visual Studio Code
Last Updated on January 25, 2024 by Editorial Team
Author(s): Fabio Yáñez Romero
Originally published on Towards AI.
Are you still writing print statements in Python to find out where the code fails? That may work for simple code, but the bigger the code gets, the more complicated it becomes to find bugs that way.
Until recently, I used print statements in my code. Learning to debug with a text editor takes time, while putting a couple of print statements is quite intuitive. However, learning to debug properly will save you a lot of time.
Since I learned to debug using Visual Studio Code (VSC) the time I spend in getting code working has drastically reduced, as well as in understanding other people’s code.
In this tutorial, I’ll show you all the tips and tricks I’ve learned in debugging Python code. To do this, we will explore the VSC debugger with a recursive function.
Recursion is a logical concept widely used in programming, in short, it means having the ability to call itself.
Based on the above definition, a recursive function calls itself at some point, entering a loop until a condition is met, which terminates the loop (if this condition is not met, it would be impossible to exit the loop!).
Why are we going to use a recursive function in this post? A recursive function is a perfect example to introduce the debugger, as it is called constantly, making it more difficult to debug with print statements. Also, one of the fundamental elements of the debugger is the Call Stack, which is especially useful for recursive functions and large scripts in general. But first, let’s talk about how to start debugging the code.
We have the following script:
import numpy as np

# Quick sort algorithm
def qsort(a):
 if len(a) <= 1:
 return a
 else:
 pivot = a[int(len(a) / 2)]
 less = [x for x in a[1:] if x < pivot]
 greater = [x for x in a[1:] if x >= pivot]
 return qsort(less) + \
 [pivot] + \
 qsort(greater)

# Main program
a = np.random.randint(0, 100, 90)
a = qsort(a)
Here, we use the quick sort algorithm to sort an array of integers. As we can see at the bottom of the function, it calls itself continuously, being a recursive function.
To start debugging, we can press the RUN button on the VSC bar and hit start debugging or press this option in the top right corner icon. Once debugging, the console returns control to the user when it finds an error in the code or when a Breakpoint is reached.
Breakpoints
Breakpoints can be placed on any line you want, stopping at that line once execution reaches that point. Just click on the left edge of the line where you want to place the breakpoint! You will see a tiny red dot which represents the breakpoint.
Tip: don’t place too many breakpoints at once, it will slow down the debugging process, instead use a breakpoint right where you think the bug is.
In addition to normal breakpoints you can use conditional breakpoints, these are applied when a certain condition is met, such as one of the local variables having a specific value. To use a conditional breakpoint, just right-click on an already placed breakpoint and edit it with a specific expression.
Tip: use conditional breakpoints when you know the code fails after a certain point in a loop. This will save you a lot of time reaching the point of failure.
All breakpoints you have placed are indicated in the bottom left corner of the debugging menu, according to Figure 2. As we can see, a breakpoint is placed for uncaught exceptions.

Debugging Bar
Once we have started debugging, a toolbar will appear in the top right corner, as shown in Figure 3.

In this toolbar, we have the following elements, from left to right:
- Continue: continue execution until an error or other breakpoint is encountered.
- Step over: Jumps to the next line of code according to the order of execution. This action does not enter into a function if it is on that line, instead, it skips it, for that, we have the next button.
- Step Into: enters the specific function indicated in the current line. With this, we can jump to other scripts called by the main script.
- Step out: exits the function in which it is to return to the main flow of the code.
- Restart: Start the debugging process again from scratch.
- Stop: ends the debugging process.
It is necessary to use this toolbar and its shortcuts to navigate through the code while debugging to find the bugs.
Variables
Once you receive control during the debug process, you can see the variables defined for the line your code is running on.
These variables are located in the top left corner as shown in figure 4.
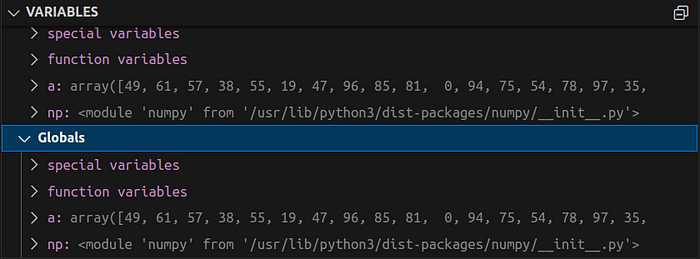
As we can see, in this case, we have two different types of variables, local and global.
As we go through the following lines of code, new variables will be added to the register while others are overwritten according to our code.
tip: you don’t need to go to the variables tab to see its current value, instead hover over the variable in the code if it has already been executed and you can see its value.
With the variables tab, we can see how each of the variables generated by the code are started and changes over time. If we use step over, we will see the change of the variables line by line.
Call Stack
Alright, now that we’ve seen how to use breakpoints and handle the debug toolbar, it’s time to talk about stacks. A stack is an array-like data structure whose elements follow the LIFO (Last In First Out) principle, whereby elements can only be added to the end of the stack and each time an element is removed it must be the last one.

The call stack uses the LIFO principle to store the execution order of each function called by the current script. This makes it a fundamental element for navigating the code while debugging. The call stack is located on top of the breakpoint register, an example of which is shown in Figure 6.

Thanks to the call stack we can see the different local variables defined in each function of the stack, which allows us to see how they vary with each iteration. So you don’t need to use print statements anymore to fix your code! Simply click on the function in the stack you are interested in, and the variables defined for that function will appear in the variables tab explained above.
tip: when debugging you may not be able to access some local variables if you are at a certain point in the call stack, to fix this, click on other points in the call stack and check if the variables are accessible.
The call stack is very useful when the executed code exports code from other files, so you can keep track of it without problems.
Debug Terminal
Last but not least, we have the debugging terminal. To access this terminal press ‘ Ctrl + Shift + Y ’. In this terminal, you can check the specific value of each variable currently defined at the point where you are in the call stack.
To do this, type the name of the variable to get its value. You can modify it and call specific methods on that variable depending on the object. We can see the debugging terminal in Figure 7.
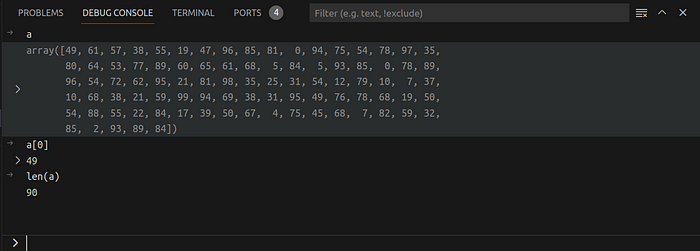
tip: use the specific methods designed for that variable in order to quickly obtain information about it, such as what information it contains, how big it is, etc.
The debug terminal is especially useful for displaying variables from the variables tab in case there are a large number of variables defined.
Entire Debug Process
Now that we have talked about the different elements that make up the debugger, let’s discuss the whole process. In Figure 8 we can see the different components that we have mentioned for debugging.
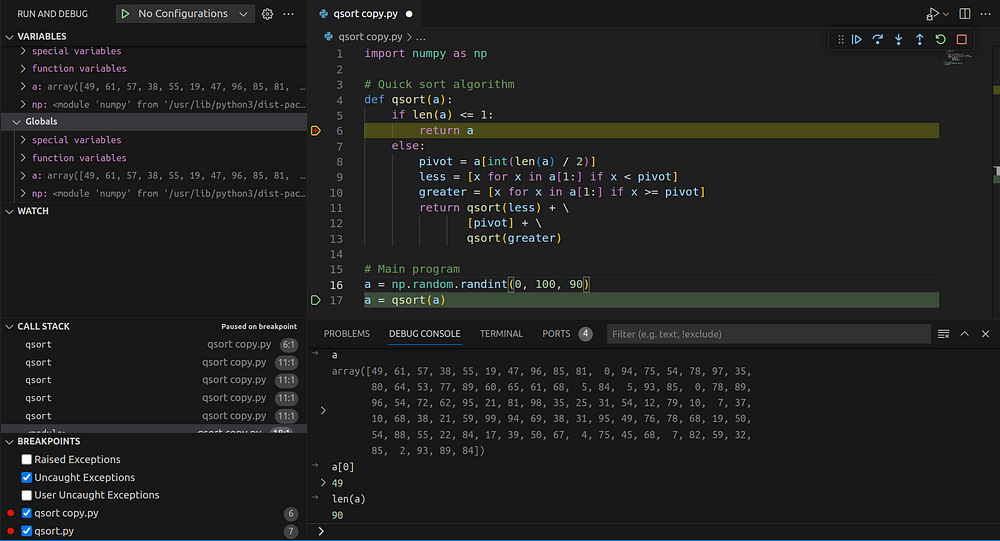
In this case, we have placed a breakpoint on line 6. So the code will stop at that line if there is no previous error.
To get to that line we can follow the trace indicated in the Call Stack, which has a new element for each time that function is called, in addition to the first time it is called on line 18. In other words, each time a function is called, an element is added to the stack.
We can see how the variables change according to the code in the variables tab. We can see how it is executed line by line using Step Over or continue to the next breakpoint with Continue, as we are inside a function we can make it exit just after executing it with a Step Out or enter a function with Step Into!
This has been a simple case, as we have only one debugging script. In a real scenario, you will have several scripts, one of them being the main one that calls the rest in different parts of the code. However, the code mentioned above illustrates the different components of the debugger, I invite you to play with it inside the VSC debugger. Happy coding!
Join thousands of data leaders on the AI newsletter. Join over 80,000 subscribers and keep up to date with the latest developments in AI. From research to projects and ideas. If you are building an AI startup, an AI-related product, or a service, we invite you to consider becoming a sponsor.
Published via Towards AI
Related posts


Popular posts

 for 2021")


Updates

Recent Posts


