


Explainable and Interpretable Models are Important in Machine Learning
Last Updated on August 1, 2023 by Editorial Team
Author(s): Suhas Maddali
Originally published on Towards AI.
Learn to use libraries such as LIME, SHAP and others to determine the workings of black-box machine learning models with examples and illustrations, ensuring that they are safe, fair and have less bias
Artificial intelligence and machine learning models have garnered significant attention due to their incredible capabilities in generating texts, predicting sentiments, and making accurate forecasts. However, a growing focus within this field is on developing explainable and interpretable models.
Consider the scenario of building a loan default classifier based on factors like age, gender, and race. While the classifier may accurately predict defaults for a specific subset of the population, questions arise regarding its accuracy for other groups. Unfair advantages and biases can emerge, granting certain groups easier access to loans while disadvantaging others. Therefore, it is crucial to prioritize the interpretability and explainability of models before deploying them in real-world applications. This example highlights just one way in which biases can manifest, emphasizing the need for careful consideration.
In this article, we delve into libraries that facilitate interpretability in machine learning models, such as LIME, SHAP, and others. By employing these libraries, we gain a comprehensive understanding of their workings and their ability to elucidate the importance of various features in driving model outcomes. Additionally, we explore the interpretability of ML models without relying on LIME and SHAP, utilizing alternative approaches.
By emphasizing interpretability, we aim to address biases and promote fairness in machine learning models. Understanding the inner workings and impacts of these models is crucial for responsible deployment and the creation of equitable solutions.
Import the Libraries
We will be importing a list of libraries that are important for the task of predicting whether a person is making an income of $50k dollars per annum based on a set of features such as age , workclass , and education . We will also perform exploratory data analysis with this data to get a full understanding of it and also recommend some insights to the business and the stakeholders.
We import libraries such as numpywhich is used for processing of data in the form of arrays.
pandas is used to convert the categorical features into one-hot encoded features that make it easier for the ML model to make predictions.
sklearn offers a wide range of options when it comes to machine learning. We have access to a large number of models, such as random forests and decision trees. It also consists of train_test_split which is used to divide the data into train and test sets.
lime is used to help us get the feature importance of values in our data. This can help us determine which of the features are really important in determining whether a person can make above or below 50$ annual income.
Read the Data
To facilitate data analysis, we utilize the fetch_openml function, which allows us to retrieve the data without storing it locally. This approach eliminates the need for the data to be physically present on our device. Let’s examine a code snippet that demonstrates how to load the data and access the first five rows:
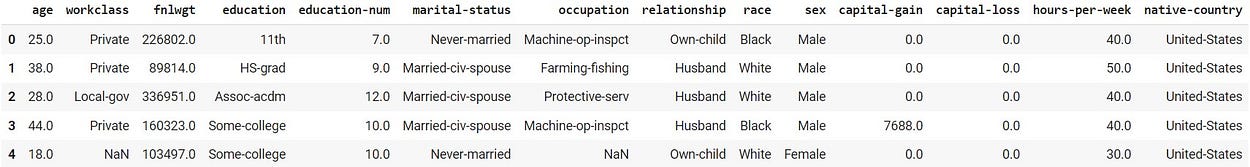
As we see that there are features such as age , workclass , and education that help determines whether a person is making above or below 50k dollars per annum.
Exploratory Data Analysis (EDA)
This is an important step in machine learning, where we tend to find patterns and trends in the data. In addition, this can also help in determining the presence of outliers, missing values, or errors in the data. In this way, we can make modifications to the data or remove features that contain these values. As a result, this leads to a more robust machine learning model that is capable of capturing a general view and making future predictions.
By looking at the above code cell, we are basically trying to get the shape of the data, null values and a high-level overview or description of the data.
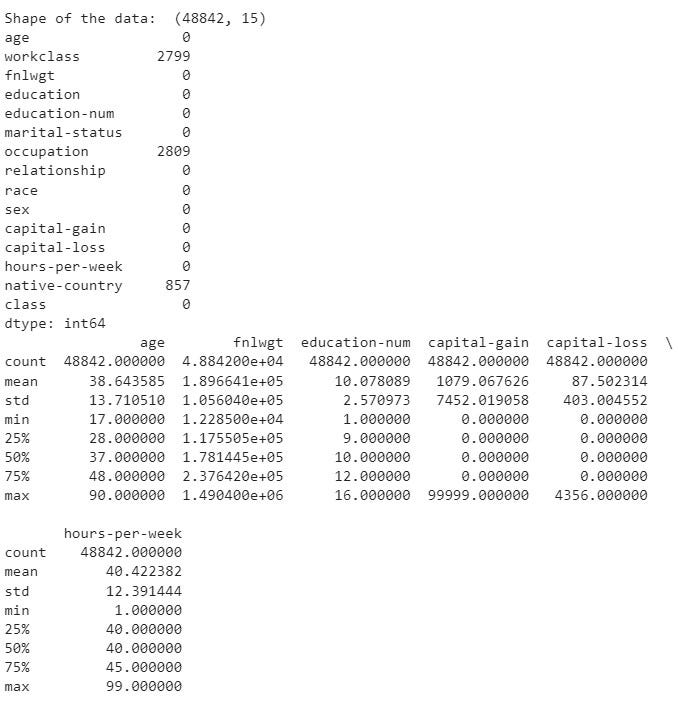
There are a few missing values in workclass , occupation , and native-country . We can treat these missing values by performing either imputation or removing them so that our models perform well on predictions.
The average age of participants in our data is about 38 years. The minimum age individual in our data is 17 years old, and the maximum age individual is 90 years. The individuals have worked about 40 hours a week on average. There are some participants who have a maximum of 99 hours per week.
In the above code cell, we are exploring the occurrence of the target values of individuals who have either above or below 50k dollars as their annual income.
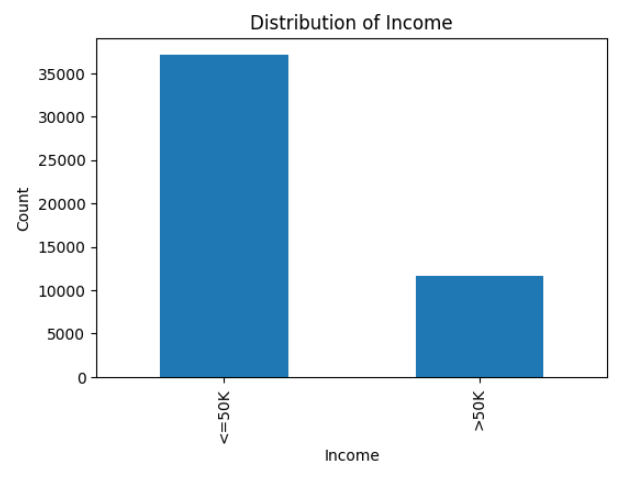
The dataset we are working with exhibits a higher proportion of individuals with an income below 50k dollars per year, which is reflective of real-world datasets where higher salaries are relatively less common. This skew in the data distribution can impact model performance, as there are more data points in the lower income category. Having a larger number of samples in one category may result in a better model performance for individuals with higher incomes.
Having explored the income category, we will now proceed to examine additional descriptive plots that provide us with a comprehensive understanding of the dataset. These visualizations will help us gain insights into various aspects of the data beyond just income, enabling us to make informed decisions and develop a more accurate model.
We are plotting the age histogram with the code cell given above. In this way, we understand the age group of individuals in our dataset before we can make predictions and improve the interpretability of the models.
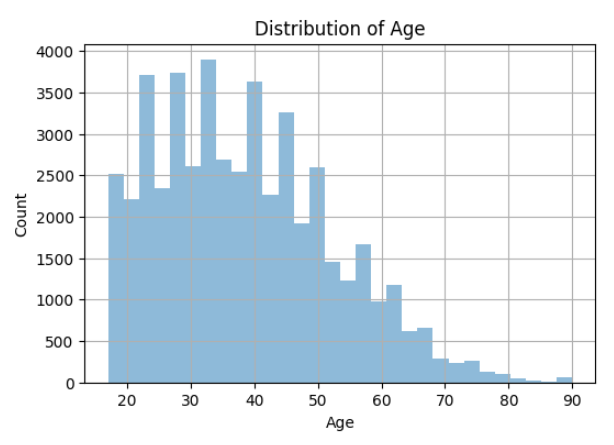
The plotted data reveals the presence of outliers in the age variable, with a few individuals appearing to be around 90 years old. However, the majority of participants fall within the age range of 30 to 50 years, which aligns with the expectation that working individuals typically belong to this age group. Additionally, it appears that the youngest age group represented in the dataset is around 20 years old. These observations provide valuable insights into the age distribution within the dataset, helping us understand the demographic composition of the participants.
Correlation plots give us a good understanding of the relationship of features with others. In this way, we are able to generate good results about how one feature is correlated with the other feature and so on. Heatmaps are a great way to visualize this correlation among features.
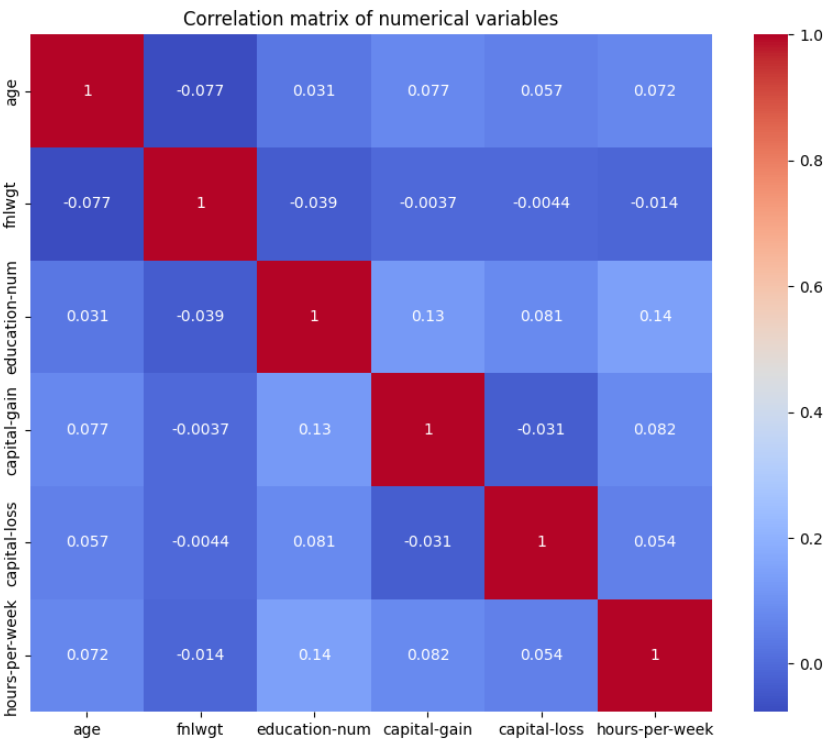
It is expected and intuitive to observe high correlation values (indicated by the red color) when a feature is compared to itself. On the other hand, the lack of high correlations between other features is a positive sign. When features are not highly correlated with each other, it suggests that they provide unique and independent information, which can enhance the performance of machine learning models by reducing redundancy and the risk of overfitting.
Given the observed correlation patterns, we can confidently utilize this dataset with various machine learning classifiers to predict income levels for individuals. The relatively low inter-feature correlations indicate that each feature contributes distinct and valuable information, making the dataset suitable for building robust and reliable models.
Boxplots give a good representation of the outliers present in the data, along with the spread and the mean of various categories. We have focused on the average age spread of people who are making either above or below 50k dollars as their annual income.
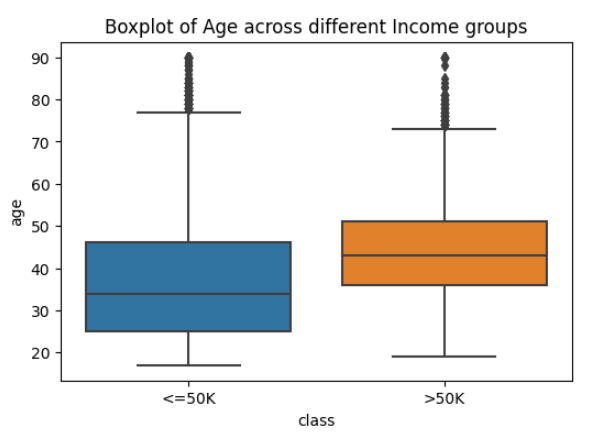
It can be seen that the age groups of people who have higher than 50k income tend to be higher as compared to young people. This highlights the importance of income levels across various classes.
We are now going to be plotting the count of work classes based on their income levels. In this way, we can get a good estimate of the total number of samples with respect to the income levels for each of the work class categories.
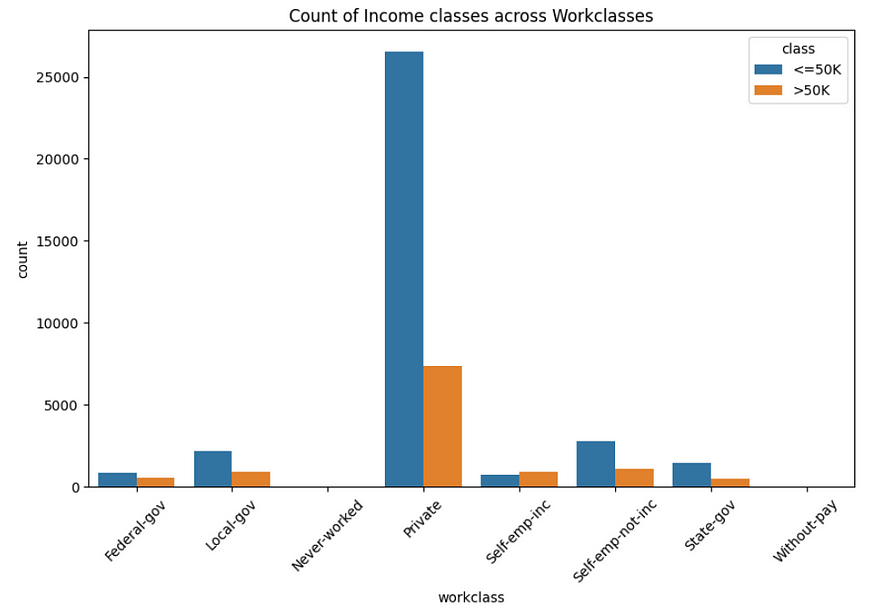
Based on the plot above, we can see that we have more number of samples of people who make about 50k dollars per annum as income for self-emp-inc category. In addition, there is Federal-gov feature that also have many candidates who have a higher relative salary range with respect to their group.
Machine Learning Predictions
Now that we have explored the data and understand some important trends and patterns, it is now time to focus our attention on machine learning predictions. Feature engineering techniques are not highlighted in this article, but it is necessary before we give the data to ML models for predictions. If you want to get a good understanding of feature engineering strategies that must be followed for any machine learning project, I encourage you to read the article below.
We will be using the random forest in our approach to predict the chances of a person making above or below 50k dollars per annum. In our case, we must first convert the categorical features to numerical features. After this step, we perform train_test_split which divide the data into train and test sets, respectively. We train using the random forest classifier with the training data and make predictions on the test set. Below is the code cell that showcases this approach.
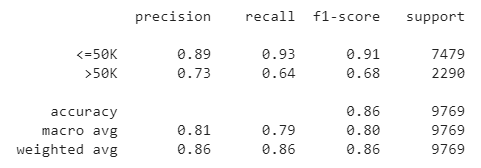
After training the model, we are able to get an accuracy of about 86 percent on the test set. The performance of each of the targets is quite consistent. Overall, the algorithm does a decent job in predicting the income status.
Interpretability and Explainability
This article revolves around the central themes of interpretability and explainability. We emphasize their significance within the discussed dataset, exploring various methods to achieve these objectives. By unraveling the inner workings of the models and understanding their decision-making process, we ensure transparency, address biases, and uphold ethical considerations. Our focus on interpretability and explainability fosters trust, accountability, and transparency in the field of machine learning.
Random Forest models are interpretable on their own as compared to other complex models, such as deep neural networks. Therefore, we will use the random forest model to generate the interpretations for its predictions.
We determine the top 10 features according to the random forest model in order to determine the total income levels. In this way, we get to know why the model is given predictions in the first place in order to lay more trust in the model predictions.
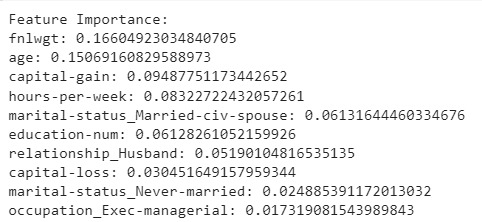
We are looking at the top 10 features in our data for our random forest model to make predictions. We will ignore the feature fnlwgt for now as it mostly deals with the weight given to each training example based on which we are determining the income levels. We see features such as age , capital-gain , and hours-per-week that are important in determining the earning potential of an individual. This is true as we have already explored about these features and their impact on the output based on exploratory data analysis. Hence, we can now lay more trust in the model as it is able to explain why it made predictions in the first place.
We will now use another library called LIME that gives an advanced set of features in order to improve the interpretability of the machine learning model.
We initialize the lime library and get the LimeTabularExplainer with the features and the columns in the dataset. A specific instance of the training data is chosen for reference. The explain_instance is capable of giving the local interpretability of the random forest model. In other words, it explains why the model has given a particular set of predictions in the first place. Finally, the feature importance of the features is generated and could be used to determine how the model came up with the predictions.
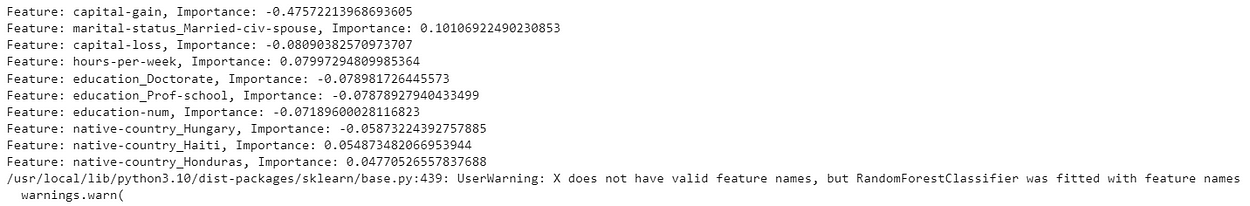
The feature importance values that are generated by lime library are different as compared to the default random forest model feature interpretation. In this case, we get negative values for those features that are inversely proportional to the output target variable and vice-versa. In addition, lime is capable of giving a local interpretation of the model predictions as compared to the global interpretation given by the default random forest library.
It is also a good idea to visualize the top 10 features from lime with the use of the above code. In this way, we can get a pictorial representation of the feature importance of the model predictions for a particular instance or training example.
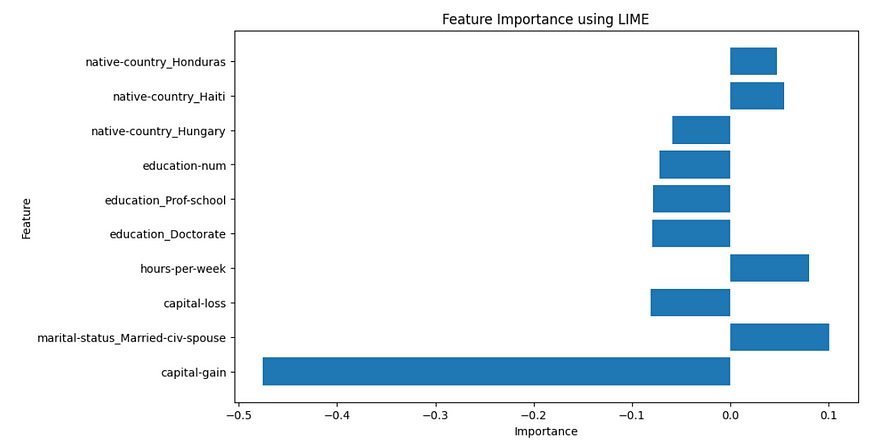
In this case, capital-gain is an important feature along with marital-status category to determine income. We will also visualize the default visualization given by lime for a specific instance below.
The above code cell uses the default library from lime that is capable of generating plots and their usefulness in determining the outcome.
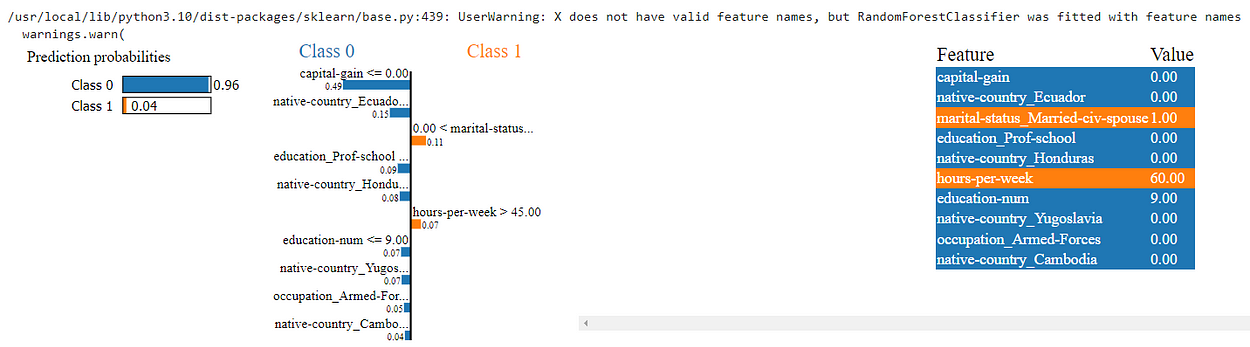
For this specific instance, our model gives with probability that this candidate makes above or below 50k dollars per annum. This shows us the confidence of the model in making the predictions as well. Furthermore, we are also given features that are highly influential in determining that this candidate makes below 50k dollars per annum.
Similarly, shap library also provides us with good interpretable results for both local and global interpretability. The above code shows how we initialize the shap library and use summar_plot to understand the model well.
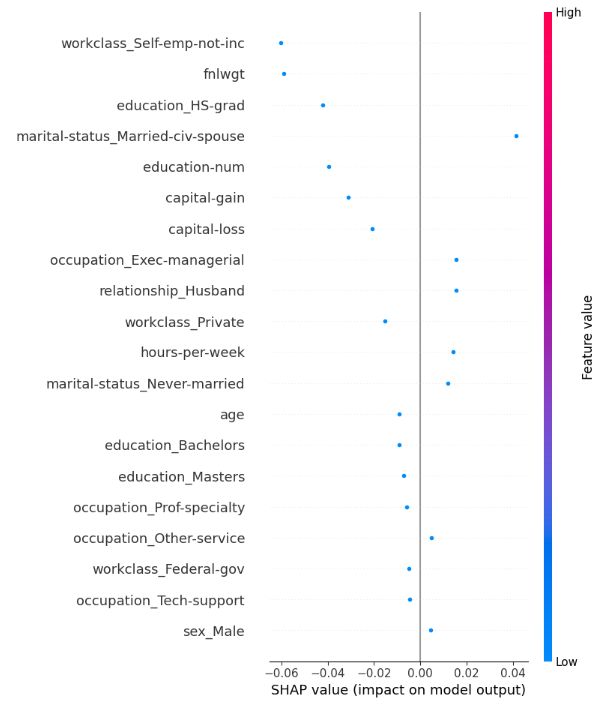
We have considered a specific instance and why the model gave predictions for this individual. education and workclass are important for this model to make predictions. In this way, we are able to get a good idea about the model and some of its weaknesses and strengths during the prediction process.
Conclusion
In conclusion, this article highlights the importance of exploratory data analysis (EDA) in data science. EDA provides valuable insights that inform decision-making during the modeling process. Additionally, libraries like lime and shap enhance the interpretability of machine learning models by identifying influential factors for predictions.
Through EDA and interpretability libraries, we gain a deeper understanding of our models’ inner workings. This knowledge allows us to explain model behavior, build trust, and ensure transparency. By combining EDA with interpretability techniques, we create more robust and reliable machine learning models.
Thorough EDA and model interpretability improve understanding, decision-making, and the overall impact of our work as data scientists. Thank you for taking the time to read this article.
Below are the ways where you could contact me or take a look at my work.
GitHub: suhasmaddali (Suhas Maddali ) (github.com)
YouTube: https://www.youtube.com/channel/UCymdyoyJBC_i7QVfbrIs-4Q
LinkedIn: (1) Suhas Maddali, Northeastern University, Data Science U+007C LinkedIn
Medium: Suhas Maddali — Medium
Kaggle: Suhas Maddali U+007C Contributor U+007C Kaggle
Join thousands of data leaders on the AI newsletter. Join over 80,000 subscribers and keep up to date with the latest developments in AI. From research to projects and ideas. If you are building an AI startup, an AI-related product, or a service, we invite you to consider becoming a sponsor.
Published via Towards AI
Related posts


Popular posts

 for 2021")


Updates

Recent Posts


