Automating Competitive Intel: From 10-Q to Insights in Minutes
Author(s): dave ginsburg
Originally published on Towards AI.
In the fast-paced world of marketing, gaining a rapid yet rigorous financial snapshot of your competitors can mean the difference between seizing an opportunity and missing the mark. Beyond press releases and news blips, the best source of unfiltered insight often lies in a company’s own SEC filings — specifically the 10-Q quarterly reports. These documents lay out everything from emerging risks to executive commentary on performance and strategy.
Introduction
To eliminate the manual slog of downloading PDFs, hunting through dozens of pages, and scribbling notes, I built a lightweight Python toolkit powered by OpenAI and SEC-API. In a single command, you can:
- Specify up to six tickers and automatically pull their latest 10-Q filings (Item 1A: Risk Factors and Item 2: MD&A).
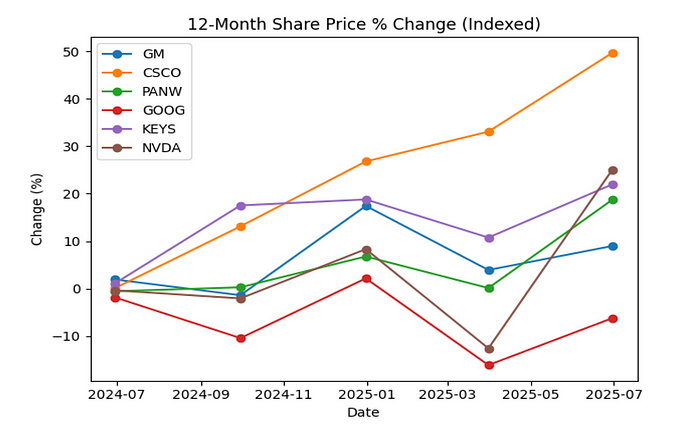
- Fetch market data from Yahoo Finance for the past year — EPS, revenue, margins, and share-price movements all indexed to zero. Note that some of the trendlines are off traditional quarter boundaries, as some companies have non-standard quarters.
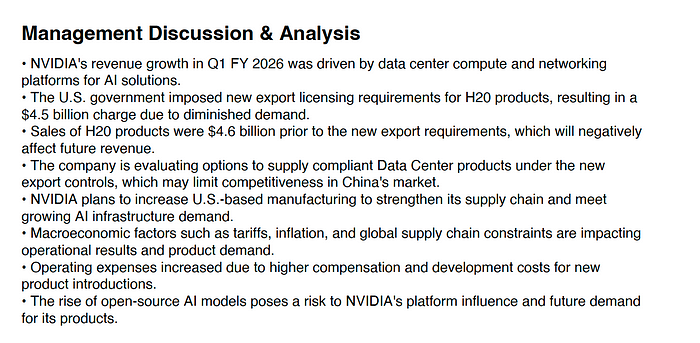
- Summarize each section via the ChatGPT API, chunking longer passages to fit within context limits. Note that focus prompts, which can be changed to emphasize other areas within items 1A and 2.
- Compile the distilled bullet-point takeaways and four customizable charts into a polished PDF report — ready to share with your team.

While SEC-API (at $55/month) handles the heavy lifting of SEC extraction, and ChatGPT powers the rapid analysis at a minimal spend of 136K tokens (for the tickers selected) with gpt-4o-mini, the entire process runs in minutes, not hours.
Note that in the scheme of things, the SEC-API cost is not out of line, and it is a much more stable method of pulling reports than many of the alternatives. Future enhancements to the script could automatically detect insider transactions or real-time material events by pulling different filings, but even in its current form, this script transforms quarterly filings from a chore into a strategic advantage.
The following sections describe the script, approaches taken, and other tools leveraged. The complete Python script follows this description, and you’ll need to specify your API keys as well as the base directory for files.
1. Configuration & Setup
- API Keys & Clients
We pull the SEC-API and OpenAI keys from environment variables (with sensible defaults hardcoded for development), then instantiate the QueryApi, ExtractorApi, and the OpenAI client.
Why? Centralizing credentials at the top makes it easy to swap in new keys or switch to a test environment without hunting through code. - Work Directory & Ticker List
All outputs (raw JSON, charts, PDF) land under /home/dave/finance. We accept up to six tickers via the command line, validating input count immediately.
Why? A single “drop zone” for artifacts keeps things tidy, and CLI flexibility lets you process any subset of companies quickly.
2. SEC 10-Q Fetch & Extraction
for each ticker:
 • Query the latest 10-Q filing
 • Pull two key sections:
 – Item 1A: Risk Factors
 – Item 2: Management Discussion & Analysis (MD&A)
 • Save as `<ticker>_10q.json`
- Why we use SEC-API instead of HTML scraping:
It returns clean JSON blobs for exactly the sections we need — no fragile XPath or PDF parsing. - Error handling per section ensures that if one extraction fails, the script continues for the others.
3. Financial Data & Chart Generation
for each ticker:
 • Download 12 months of daily closing prices via yfinance
 • Pull quarterly EPS, Revenue, Gross Profit
 • Compute quarterly gross margin % and normalize price to a 0-baseline
 • Render four Matplotlib line charts
 – EPS
 – Revenue
 – Gross Margin %
 – Indexed Share-Price Change
- Why Matplotlib + simple loops?
It’s lightweight, requires no fancy styling, and is fully scriptable in a headless server environment. - Why normalize & quarterly‐aggregate?
Quarterly snapshots smooth out daily noise and give a consistent cadence for comparison across companies.

4. Chunked GPT Summarization
Summarize section(text, section, ticker):
 1. Split text into ≤15 000-char chunks
 2. For each chunk:
 – Build a precise GPT prompt:
 • “Extract the most important … Respond with at most 8 concise bullet points …”
 – Call gpt-4o-mini
 – Regex‐extract the JSON array out of the raw reply
 – Append and dedupe
 3. Return the top 8 unique bullets
- Chunking
Long SEC sections (up to ~130,000 characters) would blow past GPT’s ~16,000-token window. By slicing into 15,000-character pieces, each API call stays safely within limits. - JSON Extraction with Regex
Even with explicit “output only JSON” instructions, models sometimes prepends or appends stray text. A simple re.search(r”\[.*\]”) guards against parse‐errors by isolating the JSON array. - Deduplication & Limiting
We gather bullets from every chunk, convert them explicitly to strings (avoiding unhashable dicts), then keep only the first 8 unique points. This yields a tight, non-redundant summary. - Exponential Backoff with Jitter
Rate limits and transient errors are handled by retrying up to six times per chunk, waiting 30 → 60 → 120 s between tries, plus a bit of random “jitter” to avoid thundering‐herd API calls.
5. PDF Assembly
doc = SimpleDocTemplate('Full_Report.pdf')
for each ticker:
 • Heading: ticker symbol
 • Subheading: Key Risks
 – Bullet list from JSON summary
 • Subheading: Management Discussion & Analysis
 – Bullet list from JSON summary
 • Page break
• Final section: “Financial Performance Overview”
 – Embed the four charts (EPS, Revenue, Margin, Price)
doc.build(elements)
- Why ReportLab?
It’s a pure-Python library with straightforward flow-document abstractions (paragraphs, images, page breaks) and no external dependencies. - Why PDF?
A single, self-contained deliverable that can be emailed, archived, or printed without worrying about missing images or mixed file types.
6. Putting It All Together
- Data Gathering
— raw SEC text + financial time series - Analysis & Summarization
— automated, bullet-point distillation of prose - Visualization
— clear charts to compare key metrics - Reporting
— one PDF combining narrative and graphics
This pipeline ensures repeatability, scalability (add more tickers as needed), and robustness (rate‐limit/backoff, chunking, JSON‐safeguards). It can be integrated into nightly jobs, reporting dashboards, or be adapted to other SEC filings (e.g. 10-Ks, 8-Ks) with minimal changes.

7. Python Script
Available at: https://github.com/daveginsburg/financial_reporting.git or https://gist.github.com/daveginsburg/6cac662c83901d167cbac63e8f8bc410
Join thousands of data leaders on the AI newsletter. Join over 80,000 subscribers and keep up to date with the latest developments in AI. From research to projects and ideas. If you are building an AI startup, an AI-related product, or a service, we invite you to consider becoming a sponsor.
Published via Towards AI


