


A quick Introduction to Machine Learning. Part-3 (Decision Tree)
Last Updated on July 17, 2023 by Editorial Team
Author(s): Abhijith S Babu
Originally published on Towards AI.
In this article, we can see how a decision tree is a useful machine-learning method. I recommend you to read part-1 and part-2 to have a basic idea about machine learning.
So far, we have seen regression methods to find the relationship between the different variables. Here we are going to use a tree-based approach. Most of you might know what a tree data structure is. If you don’t, well, it is a data structure that looks like this.
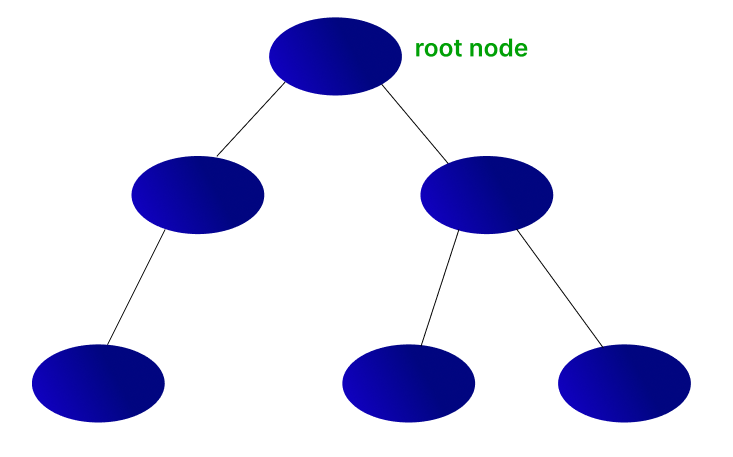
Each of the blue ellipses is a node. Nodes carry the information. Each node (except the root node) has a parent node, and a node can have zero or more child nodes. If a node doesn’t have any children, they are called leaf nodes.
Enough about the tree data structure. Now we can look at how trees are useful in Machine Learning.
Decision trees can be used in both continuous and discrete output problems. Let us take a small example, where a person purchases a car based on his salary and age.
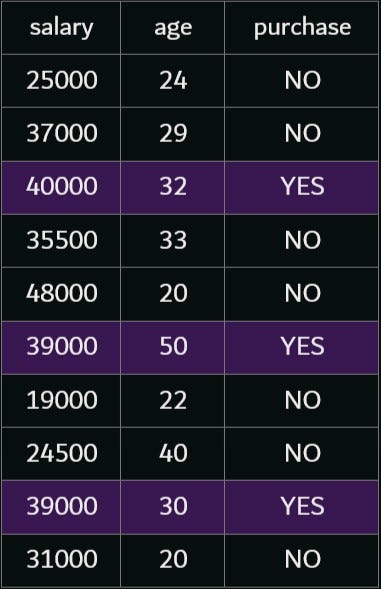
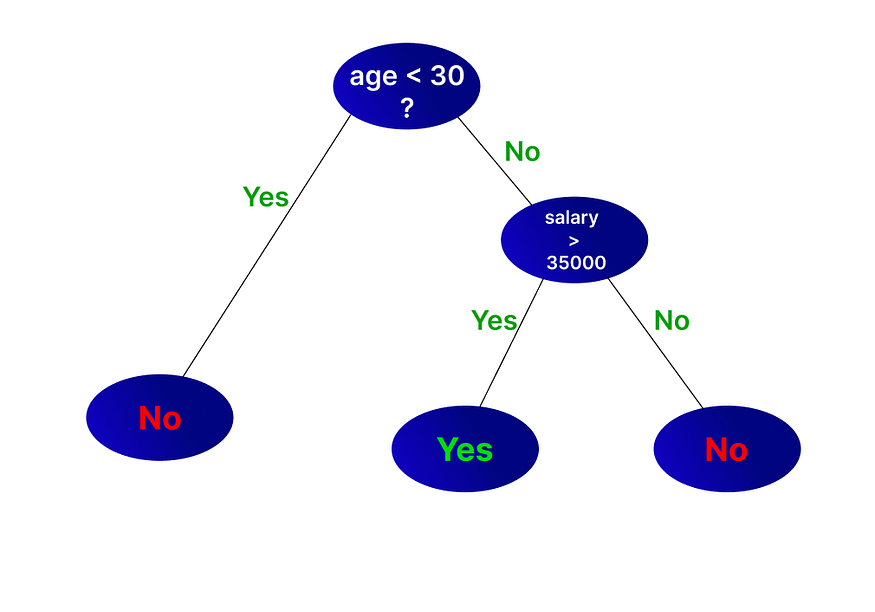
By having a rough look, we can see that a person is likely to purchase if his age and salary are high. Now we can put this data into a decision tree. In a decision tree, a node (other than a leaf node) asks a question and a link answers it. A leaf node makes a final prediction.
In this problem, we can first divide the age into two, age less than 30 and age not less than 30. When the age is less than 30, the output is always NO. when the age is 30 or above, the output depends on the salary. We can see that if the salary is higher than 35000, the output is YES, and otherwise, the output is NO.
Using this tree, we can easily solve the given problem. We can use various algorithms to train a decision tree. But you might have some questions now.
- Why did we choose age first?
- Why did we choose age < 30 and not age < 40?
Here we randomly chose age < 30 as the root node. There are several ways to determine which variable to choose and how to split them. Let’s have a look at that…
ID-3 algorithm
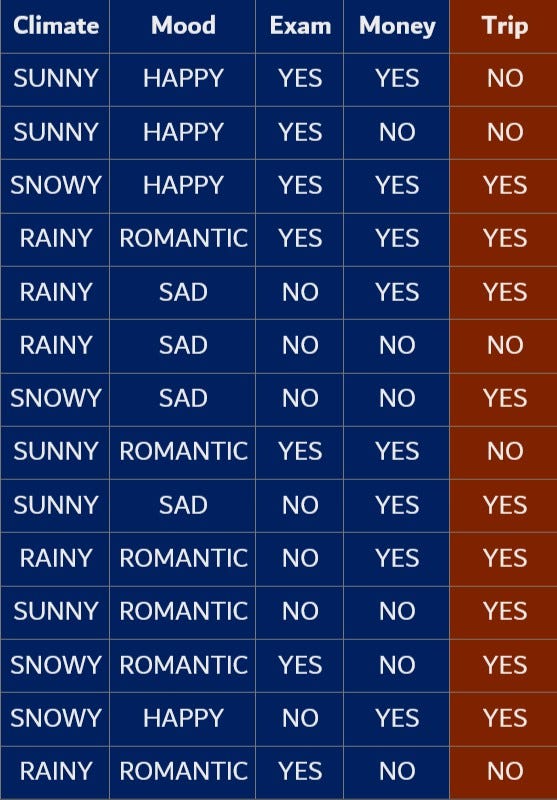
Iterative Dichotomizer-3 algorithm, a.k.a. ID-3, is a commonly used method to train a decision tree. To properly understand the algorithm, we can take an example of a student who goes on trips occasionally. Whether he goes for a trip or not depends on the climate, his mood, whether there is an exam in the coming week, and whether he has enough money. This is the data for the last 14 weeks.
Now we are going to create a decision tree for this data. The first question that comes to our mind is, which variable should I consider first???
To answer that, I introduce you to a new term known as purity. Data is pure if most of the rows have the same output. In the data given above, the output variable ‘Trip’ has the value ‘YES’ 9 times and ‘NO’ 5 times. So the data is impure. Our approach is to choose the variable that reduces the impurity.
The impurity of data is quantified by a term known as entropy. The entropy of data can be calculated using the formula.
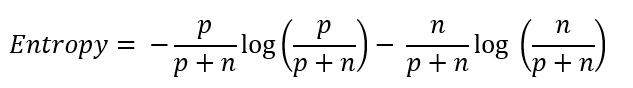
Where p is the number of times ‘YES’ is output and n is the number of times ‘NO’ is output.
Applying the above formula, we calculate the entropy of our dataset to be 0.940
Now we have to divide the dataset based on a variable such that this entropy reduces. For that, we have to choose the variable that has the minimum entropy, so that the division will reduce the entropy by a large margin.
Take the case of the variable ‘Climate’. This variable has three possible values. To calculate the total impurity contributed by the variable, first, we divide the data into three groups, based on the variable climate.
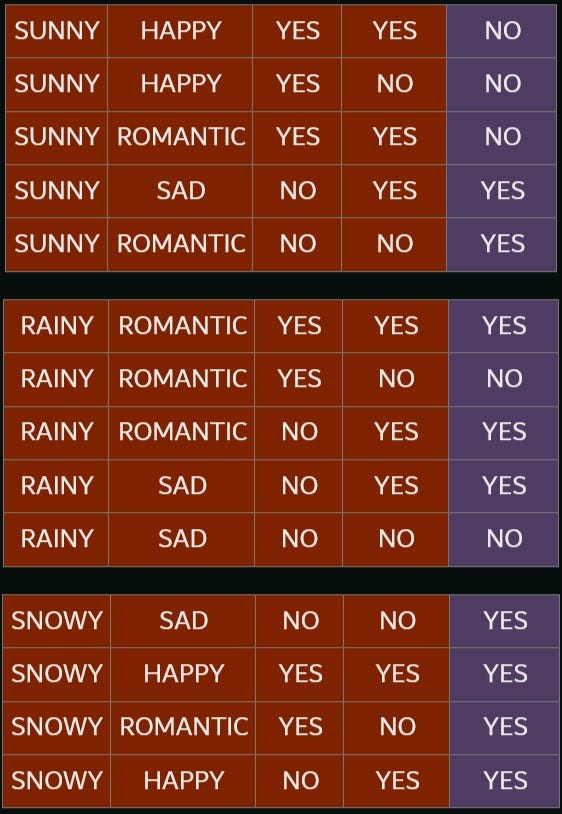
Now we can calculate the entropies of each group separately. We find that sunny has an entropy of 0.971, and rainy has an entropy of 0.971, while the entropy of snowy is 0 (since we can see that the output variable is the same for all data points). The total entropy of the variable ‘climate’ can be found by taking the weighted sum of entropies of all the groups.
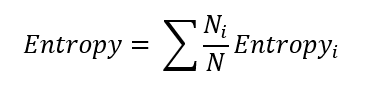
Using this formula, we got an entropy value of 0.693 for ‘climate’. Similarly, we found the entropy generated by all the variables.
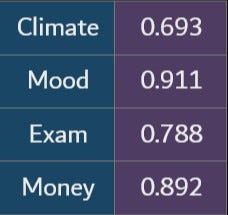
Here we can see that Climate has the least entropy. So dividing the data according to climate can reduce the total entropy significantly.
When we divide data based on climate, we can see that snowy climate always has output “YES”. But ‘sunny’ and ‘rainy’ climate are still impure. So take the two sets of data separately and repeat the process. We can see that when the climate is sunny, ‘exam’ has the lowest entropy, while when the climate is rainy, money has the lowest entropy. So, the data is divided accordingly. This is the decision tree made from the above process.
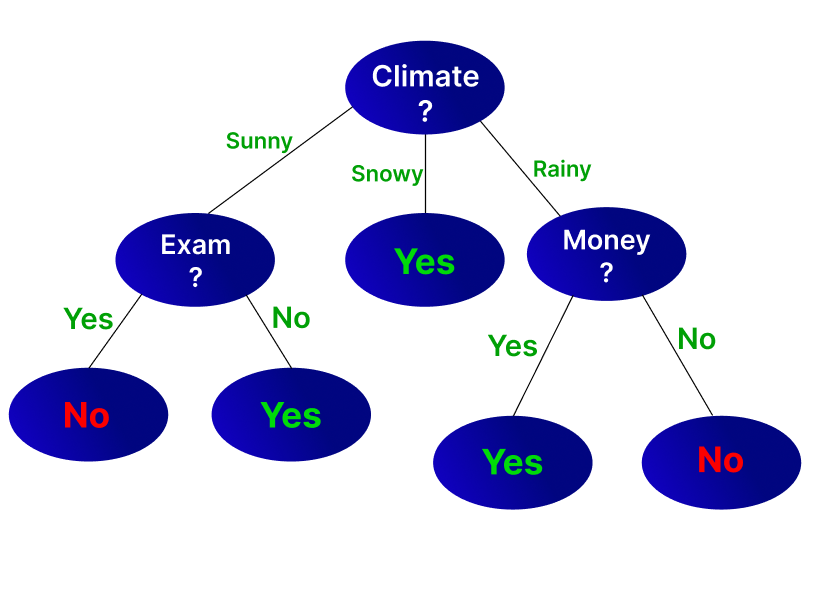
This is an efficient decision tree to make predictions in the given problem. Now in the coming week, if the climate is sunny, his mood is happy, the exam is there, and money is not there, we can use this decision tree to predict that he won’t be going on a trip.
In the above case, the root node has three child nodes, because the variable climate has three possible values. In many cases, to improve computational efficiency, it is better to have a maximum of 2 child nodes for a parent node. (Such a tree is called a binary tree). But how can we achieve that? In this case, the three values should be divided into two groups and each group will lead to a particular child node. But what is the optimal division of the values?
Take another situation in which an input variable is continuous. Remember the previous example where we predict a purchase based on salary and age. We divided age at 30 and salary at 35000. But how can we find the best point to divide these variables?
Using ID-3, it is hard to solve these problems. Various other algorithms are used to address these issues. In part-4, we can see how they are addressed. Follow me to get the upcoming parts. Give your doubts and suggestions in the response and they will be considered in the upcoming parts. Happy reading!!!
Join thousands of data leaders on the AI newsletter. Join over 80,000 subscribers and keep up to date with the latest developments in AI. From research to projects and ideas. If you are building an AI startup, an AI-related product, or a service, we invite you to consider becoming a sponsor.
Published via Towards AI
Related posts


Popular posts

 for 2021")


Updates

Recent Posts


