


A Data Analysis Project — Amazon Prime Video Userbase & Their Usage Analysis.
Last Updated on April 22, 2024 by Editorial Team
Author(s): Kamireddy Mahendra
Originally published on Towards AI.
“Gaining Excitement in Investigating Insights inbuild in any kind of data Will Lead us to Show the Path to many businesses to Solve their Problems”
I hope you have already gone through the previous Data Analysis Project articles that I shared. If not, kindly visit the links below to catch up on the flow of data analysis.
Data Analysis Project Series:
i. A Data Analysis Project — Coffee Shop Sales Analysis.
ii. A Data Analysis Project — Adidas Sales Report.
iii. A Data Analysis Project — Electric Vehicle Population data.
iv. A Data Analysis Project- Data Science Job Postings.
In this article, we will try to do the data analysis differently, just to make a slider difference from the previous data analysis projects to be more inclined to real-world projects.
I recently started my service as a freelancer. You can contact me via my Upwork page or hire me for any assistance in data and data analytics-related work. You can also contact me at: [email protected]
Generally in any business, there will be many data entities depending upon the business. For Example in this data analysis project i.e. Amazon Prime Video Userbase and Usage Data Analysis Project, I Considered three data entities. Those are
- Users Information
- Platform Information
- Payment details
In General, There could be many more data entities that we need to derive from the master data that will be given to us by the business and build a relationship between them. This process we call Data Modelling by building a relationship among fact and dimensions tables for Ease of analysis, data organization, scalability, data integrity, and data optimizations.
Let’s Look into Fact and Dimension Tables In Brief:
These are the fundamental concepts in any data warehousing. Since we need to use a data warehouse mostly for analysis purposes, where we should use proper techniques to do the data analysis with more ease.
By dividing the entire data into fact and dimension tables we would get many advantages as I already mentioned above.
Fact Table:
- Fact Table Stores Quantitative or numerical data which we generally call Fact Values.
- For Example, sales sold or purchases, sales amount, number of viewers, how much profits, and so on are directly related to fact values in any way to the business.
- Fact Tables are mostly used for transactional data.
Dimension Table:
- Dimension Table will Store the Description of the data related to the context.
- For example, User or customer details like name, location, age, gender,….., product details, market information, and so on…….
- This table is used mainly for dividing different categories or to do filtered data analysis purposes.
In summary, we can say fact tables hold the numbers or factual values, while dimension tables provide the context or descriptions. Those will work together to support data analysis and reporting purposes.
I hope you are aware that These tables can be created by writing DAX Queries in the New Table Creation method in Power BI. I wish you could do it for further steps in your projects.
I Collected sample data from one of the open source platforms i.e. Kaggle. The data that I collected here, didn’t have as many fact and dimension values as in real-world projects. I’m Just guiding you the way how it can be in real-world projects by taking a sample and simple data for your reference.
Here I have shown a few tables below that I have derived from a master table for further data analysis with the help of data modeling by considering different attributes or columns. The selection of these columns can vary based on business requirements.
Payment Information Table:

User information:
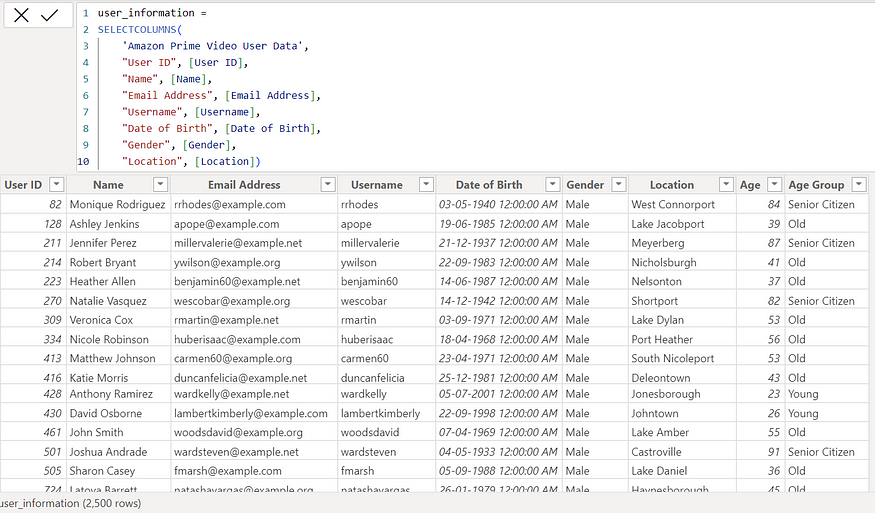
Prime Video Platform Information:

Importance of Data Modelling:
Data Modelling is essential in organizing the data in a structured way. So, it will allow us to do data analysis by defining the relationships among each data entity to ensure the data quality, scalability, flexibility, and integrity to gain meaningful insights from a whole business point of view.

The Necessity of Derived Columns Suitable to Business Needs
- We should understand one thing, that it is not necessary to have our required parameters or attributes to solve the business problem in the given data.
- Sometimes we need to derive the desired columns to make sure to solve the business problems.
- Hope you will find what all I derived just to show you some samples. But in real world projects, there could be a lot more to solve the business problems. real-world
- Therefore, It is necessary to have a clear idea of business and what parameters could help to solve business problems. Data analysts who derive them from the data will play a key role in solving any business problem.
As I already told you before, In this article, I’m trying differently to make you aware of doing the data analysis process as inclined to the real-world project.
I am not going to share the detailed analysis as I usually do it in general, as you can see in my previous articles, to cut down the size of the article. I would like to Keep everything open for you to do data analysis in depth as much as possible to solve business problems.
Tasks for a Data Analyst:
- Understand the data and business problems. You can raise as many questions as possible by yourself and that will help in solving problems somehow in general.
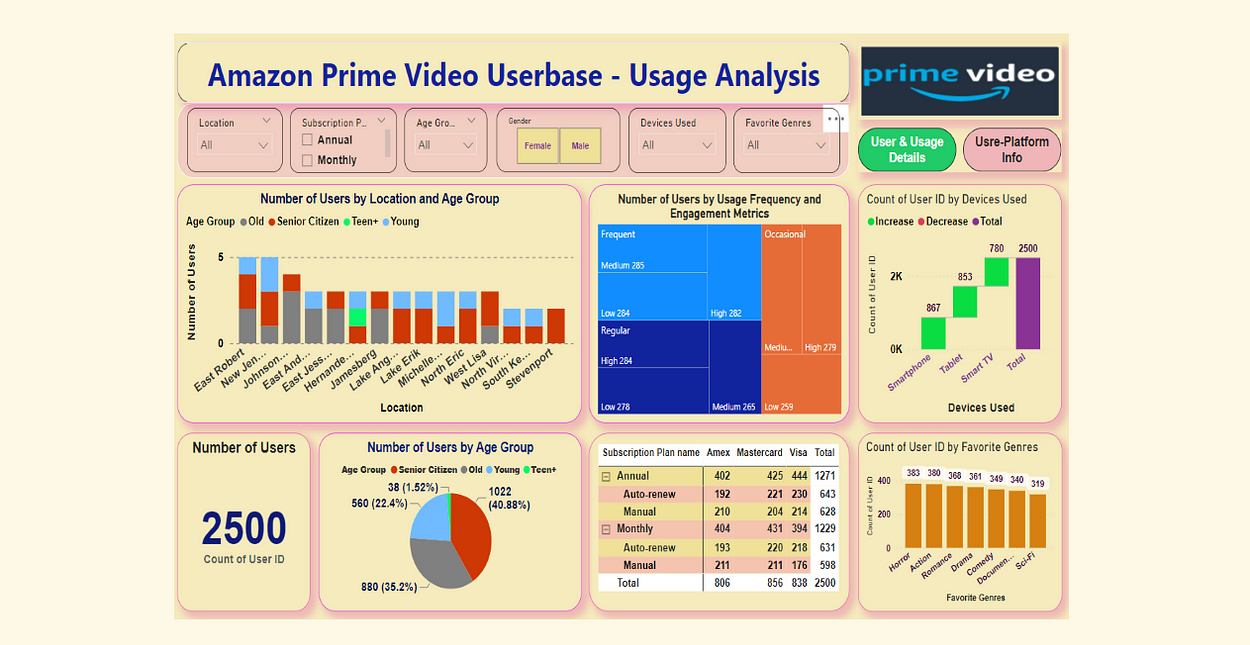
- Prepare Ad-hoc data analysis and find the insights that you observed. You can Share with me insights that you observed from the below dashboard that will help you to think about the business problems and possible solutions.
- I’m looking forward to hearing any information that you especially observed and to finding a way to solve any problems that you encounter.
Feeling Excited?
Let’s Dive into the world of data and Try to swim as much as you can. All the Best.
I hope this article is helpful for you in proceeding with data analysis and applying basic concepts to do data analysis through data modeling and visualizations with creating dashboards.

Click Here to Prepare a few data analyst interview questions and use cases in my reading list focused on data analysis. You can see the data and Power BI files on my GitHub.
I hope you will Bring your hands together to create a resounding clap to show your support and encouragement for me to share even more quality and valuable content in the future.
Follow me to catch any updates from me.
Thank you 🙂
Join thousands of data leaders on the AI newsletter. Join over 80,000 subscribers and keep up to date with the latest developments in AI. From research to projects and ideas. If you are building an AI startup, an AI-related product, or a service, we invite you to consider becoming a sponsor.
Published via Towards AI
Related posts


Popular posts

 for 2021")


Updates

Recent Posts


