Logo:
Logo:  Areas Served:
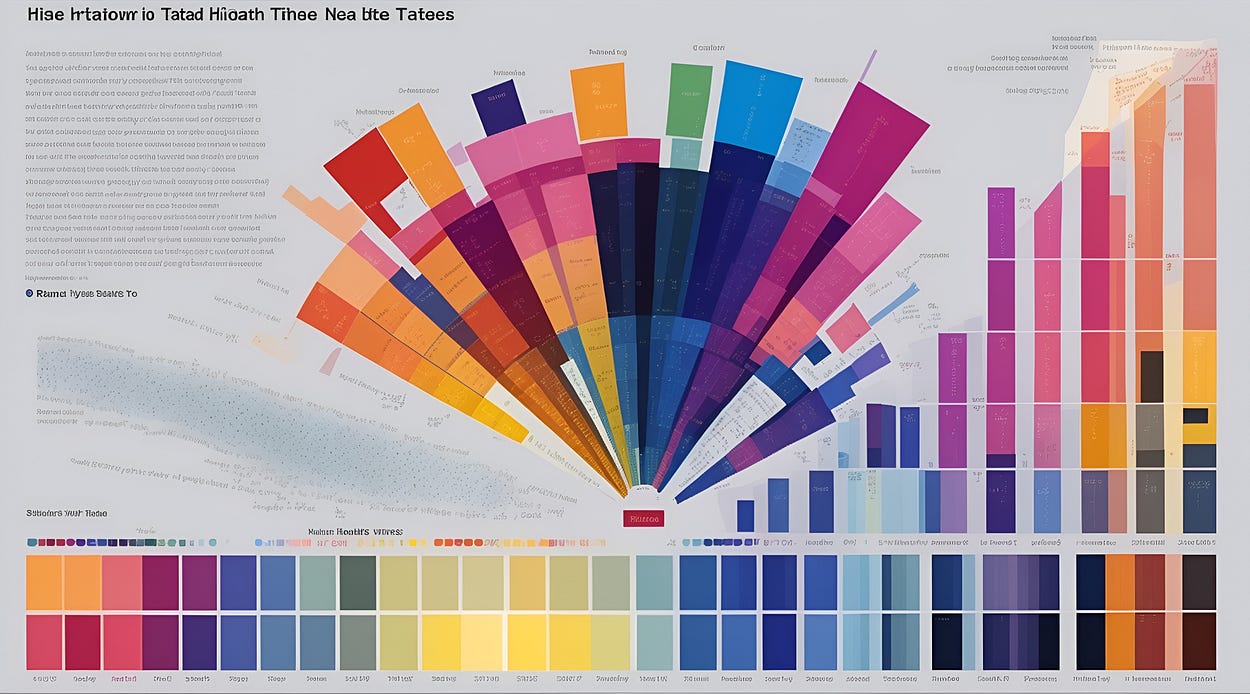
3 Best (Often Better) Alternatives To Histograms
Last Updated on November 6, 2023 by Editorial Team
Author(s): Bex T.
Originally published on Towards AI.
Avoid the most dangerous pitfall of histograms
Top highlight
Image by me with Leonardo AI
Histograms are probably the first plot you might have used as you embark on your journey as a data scientist. They are intuitive and easy plots to understand the shapes of distributions.
However, as you progress through your journey, you will find that histograms are not so peachy. Histograms group the values into intervals called bins, and the height of each bin in a histogram tells the number of points in that bin. Consider this example:
Image by author
From this histogram, we can immediately see that most scores are between 60 and 80. Let’s see what… Read the full blog for free on Medium.
Join thousands of data leaders on the AI newsletter. Join over 80,000 subscribers and keep up to date with the latest developments in AI. From research to projects and ideas. If you are building an AI startup, an AI-related product, or a service, we invite you to consider becoming a sponsor.
Published via Towards AI
Related posts
Popular posts

 for 2021")


Updates

Recent Posts