
When Variance and Standard Deviation Fail to Explain Variability!
Last Updated on July 20, 2023 by Editorial Team
Author(s): Astha Puri
Originally published on Towards AI.
We all know the definition of variance — it helps us understand how dispersed the data points are, around the mean.
If the data points are far off from the mean, we have larger curves than if the points lie close to the mean.


Given a set of n sample observations, the formula to calculate sample variance is:
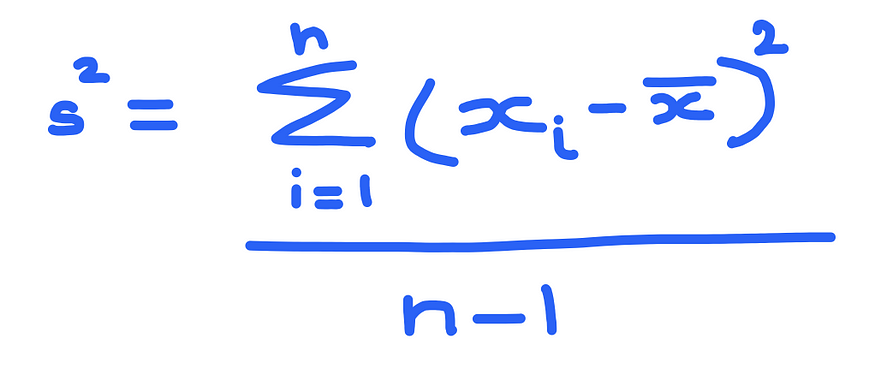
where xbar is the sample mean.
Say a dataset consists of only 2 points -> x1 and x2.
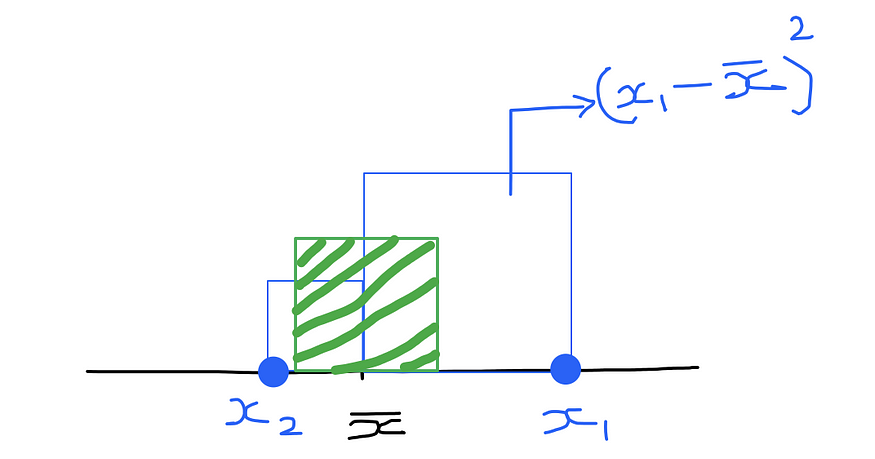
To calculate variance,
- First step — find the distance of each point from the mean. Imagine this distance to be the side of a square.
- Second step — This distance to the power 2 would be the area of the square formed by each point (blue boxes)
- Third step — And variance would be the mean area of all these squares — represented by the green box above for the case of 2 points x1 and x2.
Standard deviation = square root of variance — -> this turns out to be the side of the green box (box representing the mean area of all the other blue squares)
The issue with variance is that its units are squared.
Consider this Kaggle dataset which lists Airbnbs in Madrid, Spain

(https://www.kaggle.com/rusiano/madrid-airbnb-data).
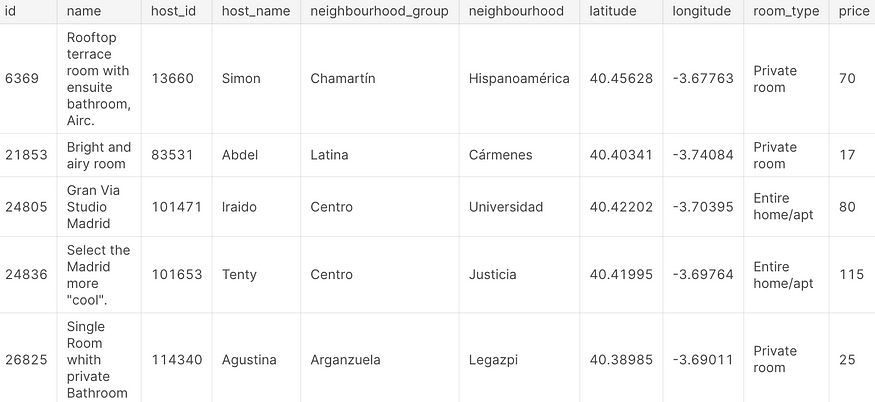
If we calculate the variance of prices of these Airbnb listings, we would get it in euro square which is not very interpretable. So, we have something called the standard deviation which is the square root of variance. Standard deviation is the most common measure of variability and it solved the problem if units being squared that we have in using a variance.
So where does standard deviation fail?
Say we have to compare 2 datasets — one listing these Airbnb prices in euro and the other in USD.

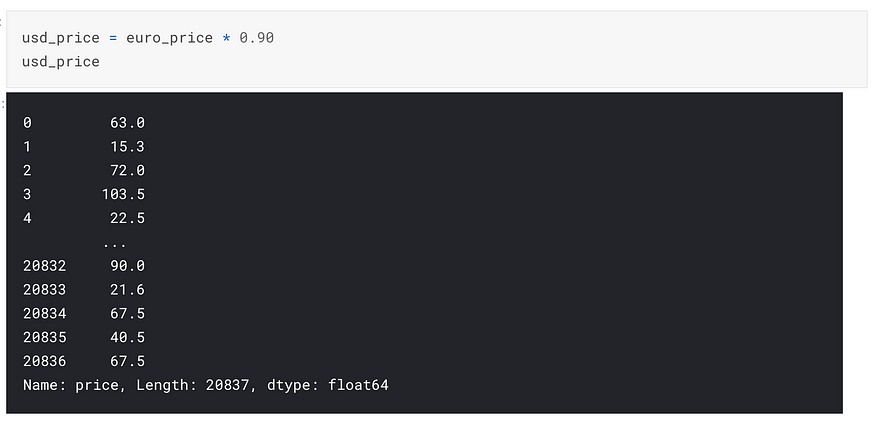
The standard deviation that we get for both these data sets would be different even though they list the same geography and same house listings for the same price — their measure of variability i.e standard deviation, in this case, gives different values.


When we want to compare the dispersion of different datasets, we want to able to compare them in absolute terms. This is where the coefficient of variation can help. It helps to compare the variability of 2 different data sets. The formula of the coefficient of variation for a sample is simply the sample standard deviation divided by the sample mean.
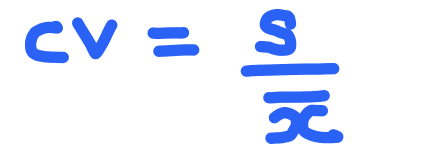
Let's apply the coefficient of variation to the above example:


So, in the case of these Airbnb listings, irrespective of how we look at the price in the two different datasets, since they are the same exact house listings that we are comparing, the coefficient of variation is the same even though the standard deviation differs.
Thus, the standard deviation is the best most common measure of variability if we are looking at a SINGLE DATASET. The coefficient of variation is useful when we want to compare variability in DIFFERENT DATASETS.
Join thousands of data leaders on the AI newsletter. Join over 80,000 subscribers and keep up to date with the latest developments in AI. From research to projects and ideas. If you are building an AI startup, an AI-related product, or a service, we invite you to consider becoming a sponsor.
Published via Towards AI
Take our 90+ lesson From Beginner to Advanced LLM Developer Certification: From choosing a project to deploying a working product this is the most comprehensive and practical LLM course out there!
Towards AI has published Building LLMs for Production—our 470+ page guide to mastering LLMs with practical projects and expert insights!

Discover Your Dream AI Career at Towards AI Jobs
Towards AI has built a jobs board tailored specifically to Machine Learning and Data Science Jobs and Skills. Our software searches for live AI jobs each hour, labels and categorises them and makes them easily searchable. Explore over 40,000 live jobs today with Towards AI Jobs!
Note: Content contains the views of the contributing authors and not Towards AI.


