


Using AI to Implement Vector-Based Technology in Topic Modeling
Last Updated on January 7, 2023 by Editorial Team
Last Updated on August 11, 2022 by Editorial Team
Author(s): Kirsten Jiayi Pan
Originally published on Towards AI the World’s Leading AI and Technology News and Media Company. If you are building an AI-related product or service, we invite you to consider becoming an AI sponsor. At Towards AI, we help scale AI and technology startups. Let us help you unleash your technology to the masses.
Introduction
In this article, we are going to analyze 50 thousand Covid-related tweets that we scraped from Twitter, using AI to extract the main topics argued by people around the world.
For this amount of unstructured data, we would require weeks to read and classify your data. This Gargantuan task, however, could be a piece of cake if we properly know how to use state-of-the-art NLP models.
To perform this task, we are going to use models called encoders and a method that allows us to group similar topics together in an automated fashion called topic modeling.
Text Encoding
Before starting to work on our code directly, we will first explain the logic behind it. The main technique we are going to use to execute this task is called encoding, or vectorization. By using models called embeddings, we are able to convert plain text into geometric coordinates belonging to a high-dimensional space (hundreds of dimensions).
Each dot in space represents a text. The value of encoders is that it can place text with a similar meaning closer in space. With this unique tool, we can then apply machine learning techniques to group data into common trends.
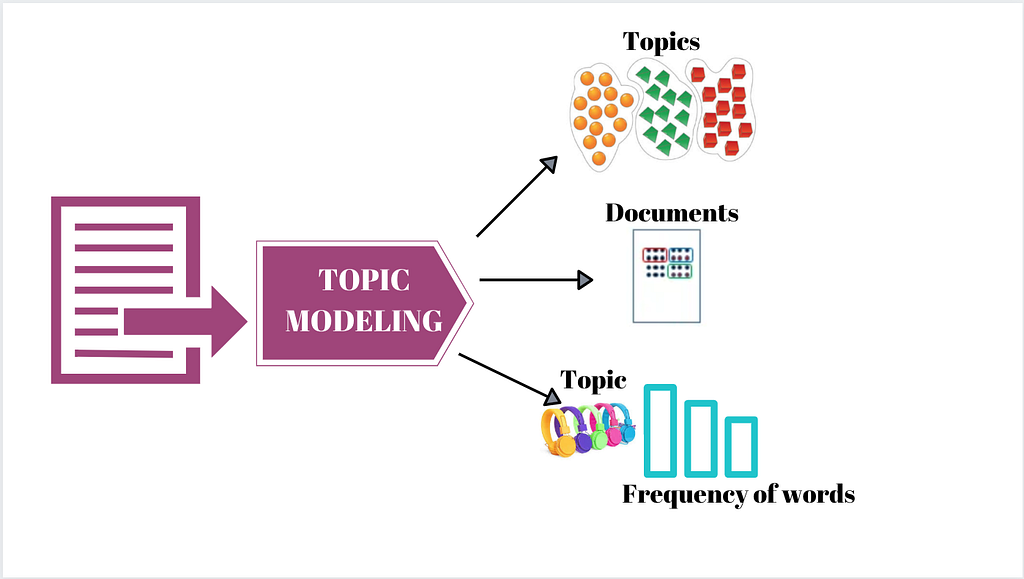
What is Topic Modeling, and why is it important?
Topic modeling is an algorithm that, when applied to plain text, is able to extract the main topics discussed in the corpus. Once we have vectorized all our tweets and we have 50.000 dots in our high-dimensional cartesian plane, we can group them by using clustering techniques.
Each group of dots will share a similar meanings, hence similar topics. We can group 50.000 samples into a few hundred separate groups. By extracting the most frequent keyword from each group, we will then be able to label each individual group with its corresponding topic.
On Hand! In this project, we have 4 parts to cover:
- Web Scraping:
We will first scrape 50 thousand tweets about Covid-19 Vaccination in the span of 6 months as our sample corpus. The Python library we will be using is called snscrape.
FYI: https://github.com/JustAnotherArchivist/snscrape

In this sample corpus, we are only saving two pieces of information: the time of the tweet that was published and the text of the tweets.
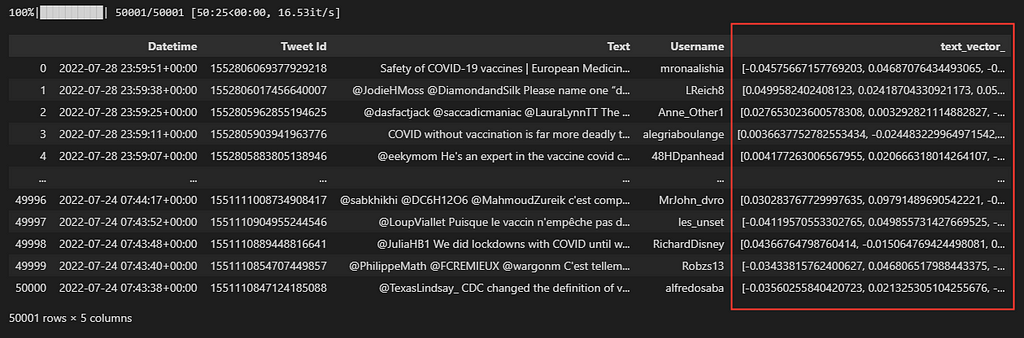
2. Encoding:
Now we move on to the highlight of this project! We can also call this part encoding since we are converting text data to numerical data. The Python library that we will be using is called SentenceTransformerwhich can help us implement several pre-trained encoding models. The pre-trained model from SentenceTransformerthat we use is all-MiniLM-L6-v2which will create 768 dimensions for each tweet. This model is robust and fast. To see more details about pre-trained models for SentenceTransformer, please review https://www.sbert.net/docs/pretrained_models.html for more information.
Note: Don’t forget to add an additional column to store the text vector for our dataset.
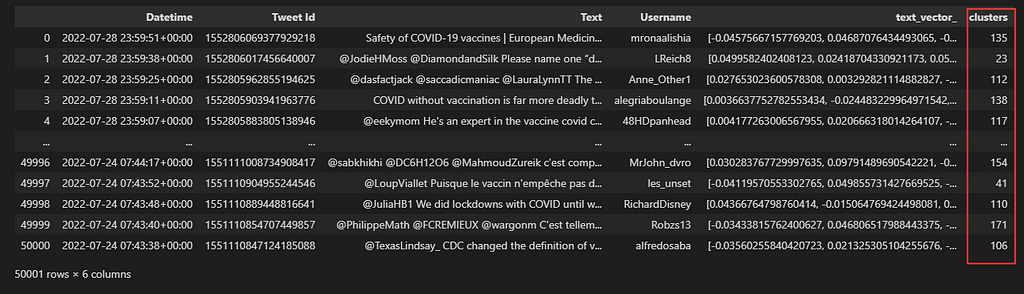
3. Clustering:
You might be familiar with clustering already. We are going to import KMeansfrom the scikit-learn Python library. Then we can define how many clusters we want for our corpus. As a rule of thumb, over 10,000 samples, we are going to group our data into 200 clusters.
4. Visualization:
Once we have finished clustering our data. We want to visualize the outcome and see how our clustering model groups the tweets into different topics. However, we must reduce the dimension before visualization from 768 dimensions to 2 dimensions so we can understand our visualization of clustering as human beings. The dimensionality reduction algorithm we use for dimension reduction is umap.
FYI: https://umap-learn.readthedocs.io/en/latest/
Here is how we visualize our clustering by generating a 2-dimensional colorful graph by using matplotlib.plotly.
FYI: https://www.activestate.com/blog/plotting-data-in-python-matplotlib-vs-plotly/
As you can see in our beautiful graph draw, our 50 thousand tweets are grouped in 200 clusters with 200 colors on a 2-dimensional plane. The graph will represent the tweets that are grouped under the same topic using the same color.
Conclusion
Since we have clustered the corpus by scanning the similarity, frequency of words, and patterns within the text, we can easily understand what are the most popular trends when people discussing about Covid-19 Vaccination. The insights that can be extracted using this algorithm will prove valuable to the Public Health Industry and Governments that need to monitor data constantly.
Using AI to Implement Vector-Based Technology in Topic Modeling was originally published in Towards AI on Medium, where people are continuing the conversation by highlighting and responding to this story.
Join thousands of data leaders on the AI newsletter. It’s free, we don’t spam, and we never share your email address. Keep up to date with the latest work in AI. From research to projects and ideas. If you are building an AI startup, an AI-related product, or a service, we invite you to consider becoming a sponsor.
Published via Towards AI
Towards AI Academy
We Build Enterprise-Grade AI. We'll Teach You to Master It Too.
15 engineers. 100,000+ students. Towards AI Academy teaches what actually survives production.
Start free — no commitment:
→ 6-Day Agentic AI Engineering Email Guide — one practical lesson per day
→ Agents Architecture Cheatsheet — 3 years of architecture decisions in 6 pages
Our courses:
→ AI Engineering Certification — 90+ lessons from project selection to deployed product. The most comprehensive practical LLM course out there.
→ Agent Engineering Course — Hands on with production agent architectures, memory, routing, and eval frameworks — built from real enterprise engagements.
→ AI for Work — Understand, evaluate, and apply AI for complex work tasks.
Note: Article content contains the views of the contributing authors and not Towards AI.
Related posts
Recent Posts


")