


Starbucks Sales Analysis – Part 1
Last Updated on December 28, 2021 by Editorial Team
Author(s): Abhishek Jana
Originally published on Towards AI the World’s Leading AI and Technology News and Media Company. If you are building an AI-related product or service, we invite you to consider becoming an AI sponsor. At Towards AI, we help scale AI and technology startups. Let us help you unleash your technology to the masses.
Data Analysis
An in-depth look at Starbucks sales data!
Every data tells a story! As a part of Udacity’s Data Science nano-degree program, I was fortunate enough to have a look at Starbucks ’ sales data. In this capstone project, I was free to analyze the data in my way. So, in this blog, I will try to explain what I did.
Dataset Overview
The data was created to get an overview of the following things:
- To observe the purchase decision of people based on different promotional offers.
- There are three types of offers: BOGO ( buy one get one ), discount, and informational. I wanted to see the influence of these offers on purchases.
- Finally, I wanted to see how the offers influence a particular group of people.
There are 3 files in the dataset:
profile.json
Rewards program users (17000 users x 5 fields)
- gender: (categorical) M, F, O, or null
- age: (numeric) missing value encoded as 118
- id: (string/hash) id of each user.
- became_member_on: (date) format YYYYMMDD
- income: (numeric)
portfolio.json
Offers sent during the 30-day test period (10 offers x 6 fields)
- reward: (numeric) money awarded for the amount spent
- channels: (list) web, email, mobile, social
- difficulty: (numeric) money required to be spent to receive a reward
- duration: (numeric) time for the offer to be open, in days
- offer_type: (string) BOGO, discount, informational
- id: (string/hash) id of the offers
transcript.json
Event log (306648 events x 4 fields)
- person: (string/hash)
- event: (string) offer received, offer viewed, transaction, offer completed
- value: (dictionary) different values depending on event type
- offer id: (string/hash) not associated with any “transaction”
- amount: (numeric) money spent in “transaction”
- reward: (numeric) money gained from “offer completed”
- time: (numeric) hours after the start of the test
Problem Statement
There are three main questions I attempted to answer.
- What is the spending pattern based on offer type and demographics?
- How to recommend coupons/offers to current customers based on their spending pattern?
- How to recommend coupons/offers to new customers?
Data Analysis
From the portfolio.json file, I found out that there are 10 offers of 3 different types: BOGO, Discount, Informational.
BOGO: For the buy-one-get-one offer, we need to buy one product to get a product equal to the threshold value.
Discount: In this offer, a user needs to spend a certain amount to get a discount.
Informational: This type of offer has no discount or minimum amount to spend.
To redeem the offers one has to spend 0, 5, 7, 10, or 20 dollars.
The profile.json data is the information of 17000 unique people. The data has some null values. And by looking at the data we can say that some people did not disclose their gender, age, or income. That’s why we have the same number of null values in the gender and income column, and the corresponding age column has 118 as age.
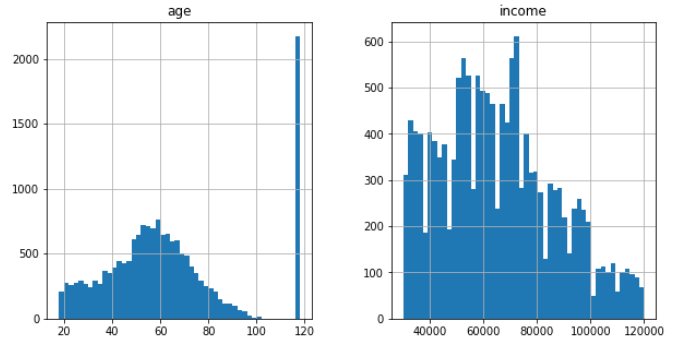
Distribution of the profile data
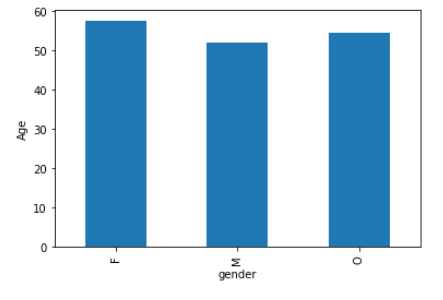
The profile data has the same mean age distribution among genders.
As we can see the age data is nearly a Gaussian distribution(slightly right-skewed) with 118 as outlier whereas the income data is right-skewed.
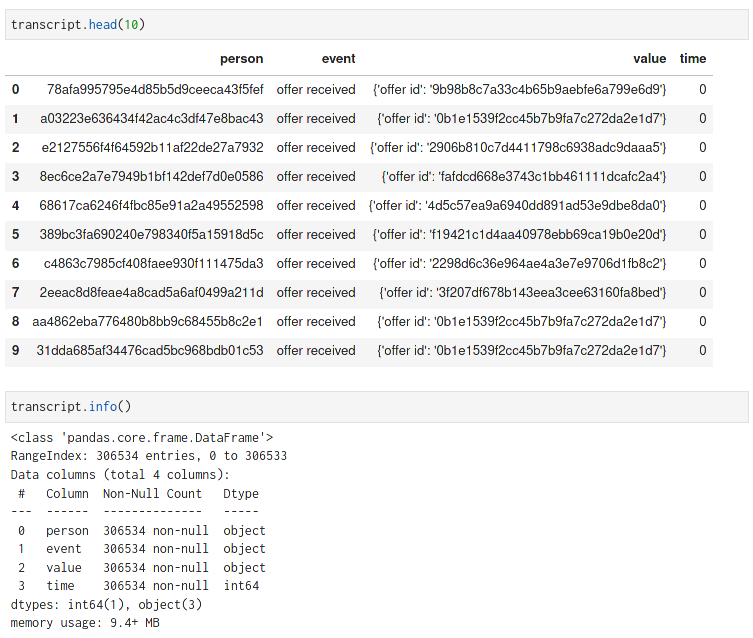
The transcript.json data has the transaction details of the 17000 unique people. 4 types of events are registered, transaction, offer received, and offer viewed
The value column has either the offer id or the amount of transaction.
Data Preprocessing
To answer the first question: What is the spending pattern based on offer type and demographics? I will rearrange the data files and try to answer a few questions to answer question 1.
The sub-questions are:
- What are the popular offers?
- How offers are utilized among different genders?
- How transaction varies with gender, age, and income?
Firstly, I merged the portfolio.json, profile.json, and transcript.json files to add the demographic information and offer information for better visualization. So my new dataset had the following columns:
'person', 'event', 'value', 'time', 'gender', 'age', 'income', 'date'.
Also, I changed the ‘null’ gender to ‘Unknown’ to make it a new feature.
Let’s recap the columns for better understanding:
- person(category): 17000 unique users.
- event(category): 4 unique categories: offer completed, offer received, offer viewed, and transaction.
- value(category/numeric): when event = ‘transaction’, value is numeric, otherwise categoric with offer id as categories.
- time(numeric): 0 is the start of the experiment.
- gender(category): 4 unique categories: Male, Female, Other, and Unknown.
- age(numeric): numeric column with 118 being unknown or outlier.
- income(numeric): numeric column with some null values corresponding to 118 age.
- date: date of the transaction.
What are the popular types of offers?
We can make a plot of what percentage of the distributed offer was BOGO, Discount, and Informational and finally find out what percentage of the offers were received, viewed, and completed.
To do so, I separated the offer data from transaction data (event = ‘transaction’).
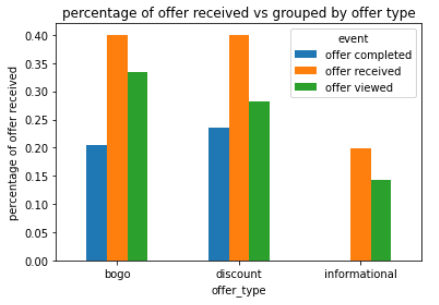
We can see that the informational offers don’t need to be completed. Although, BOGO and Discount offers were distributed evenly,
- BOGO offers were viewed more than discount offers.
- But, Discount offers were completed more.
So, discount offers were more popular in terms of completion.
How offers are utilized among different genders?
Since there is no offer completion for an ‘informational’ offer, we can ignore the rows containing ‘informational’ offers to find out the relation between offer viewed and offer completion.
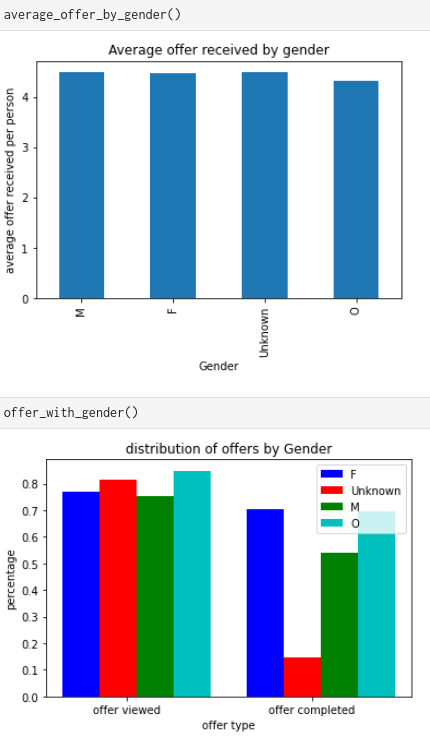
From the ‘Average offer received by gender’ plot, we see that the average offer received per person by gender is nearly the same.
The ‘distribution of offers by Gender’ plot shows the percentage of offers viewed among offers received by gender and the percentage of offers completed among offers received by gender.
We see that,
- Other customers viewed the most offers and
- Male customers viewed the least offers.
- Female customers completed the most offers and,
- The Unknown group completed the least offers.
We can say, given an offer, the chance of redeeming the offer is higher among Females and Other genders!
How transaction varies with gender, age, and income?
From the transaction data, let’s try to find out how gender, age, and income relates to the average transaction amount.
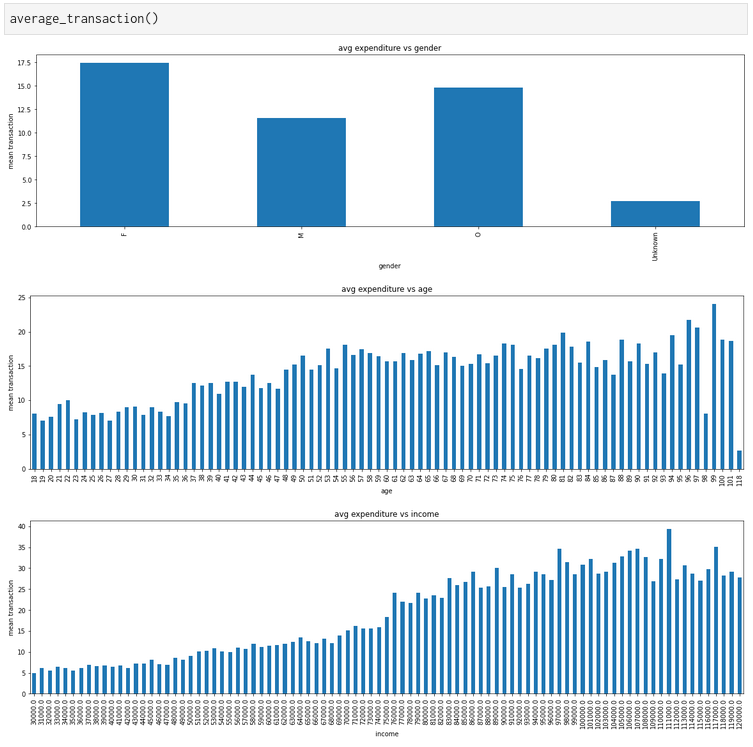
We can see the expected trend in age and income vs expenditure. With age and income, mean expenditure increases.
- In the gender plot, we see women tend to spend the most, and the group with no demographic data (Unknown gender) tends to spend the least.
- There’s a positive correlation between age and average spending.
- People spend more with higher income.
Conclusion
So, in conclusion, to answer What is the spending pattern based on offer type and demographics?
The possible answer is,
- Although BOGO offers were viewed more, Discount offers were more popular in terms of completion.
- Given an offer, the chance of redeeming the offer is higher among Females and Other genders!
- Women tend to spend the most.
- Spending increases with age and income.
In part 2 of this blog, I will explain,
- How to recommend coupons/offers to current customers based on their spending pattern?
- How to recommend coupons/offers to new customers?
A link to part 2 of this blog can be found here.
The GitHub repository of this project can be found here.
Starbucks Sales Analysis – Part 1 was originally published in Towards AI on Medium, where people are continuing the conversation by highlighting and responding to this story.
Join thousands of data leaders on the AI newsletter. It’s free, we don’t spam, and we never share your email address. Keep up to date with the latest work in AI. From research to projects and ideas. If you are building an AI startup, an AI-related product, or a service, we invite you to consider becoming a sponsor.
Published via Towards AI
Towards AI Academy
We Build Enterprise-Grade AI. We'll Teach You to Master It Too.
15 engineers. 100,000+ students. Towards AI Academy teaches what actually survives production.
Start free — no commitment:
→ 6-Day Agentic AI Engineering Email Guide — one practical lesson per day
→ Agents Architecture Cheatsheet — 3 years of architecture decisions in 6 pages
Our courses:
→ AI Engineering Certification — 90+ lessons from project selection to deployed product. The most comprehensive practical LLM course out there.
→ Agent Engineering Course — Hands on with production agent architectures, memory, routing, and eval frameworks — built from real enterprise engagements.
→ AI for Work — Understand, evaluate, and apply AI for complex work tasks.
Note: Article content contains the views of the contributing authors and not Towards AI.
Related posts
Recent Posts


")

