Starbucks Sales Analysis — Part 2
Last Updated on January 6, 2023 by Editorial Team
Last Updated on January 2, 2022 by Editorial Team
Author(s): Abhishek Jana
Originally published on Towards AI the World’s Leading AI and Technology News and Media Company. If you are building an AI-related product or service, we invite you to consider becoming an AI sponsor. At Towards AI, we help scale AI and technology startups. Let us help you unleash your technology to the masses.
Machine Learning
Starbucks Sales Analysis — Part 2
An in-depth look at Starbucks sales data!
If you haven’t read Part 1 of this blog, here’s the link. In Part 2 I will try to address two remaining questions:
- How to recommend coupons/offers to current customers based on their spending pattern?
- How to recommend coupons/offers to new customers?
I will show you how to build a recommendation system to recommend ideal users for each offer.
In other words, my goal is to recommend the best offers to the existing users. In this system, we select an existing offer and recommend top n users for that offer. But this can be easily extended to similar future offers.
We need to remember a few things before doing that.
- We need to identify users who completed offers without actually opening the offers. We don’t need to send out offers to these users as most likely they don’t care about the offers.
- If a user spends an average of more than $20, they are most likely don’t rely on offers.
- Since we have offer values of $5, $7, $10, and $20, we can come up with a general rule, that if a user spends an average of $15, we can recommend them a $20 offer to spend a little more.
- Finally, we would want to make recommendations for new users too. For, that we can train an ML model based on demographic data and other features to predict the amount the user will spend. And depending on the value, we can recommend them an offer or not! (for example, if the user is expected to spend more than $20, or very less than $5 we don’t send out offers).
- How to recommend coupons/offers to current customers based on their spending pattern?
There can be two possibilities for BOGO and Discount offers,
- We can set a threshold ratio of offer viewed/offer received and say if the value is more than the threshold percentage, they have a better chance of opening an offer.
- Similarly, we can set a threshold ratio of offer completed/offer viewed and say if the value is more than the threshold percentage, they have a better chance of completing an offer.
But there’s a catch! We can have people who completed an offer without even opening the offer. In that case, the ratio of offer completed/offer viewed will be greater than 1. We don’t need to send them offers as they will most likely buy products anyway. So, we need to set an upper bound too!
Finally, we can use the informational offer data and build a separate recommendation system than the BOGO and Discount offer since one doesn’t need to spend anything for this type of offer.
How to build the recommendation system?
For BOGO and Discount offer data,
- We will use rank-based recommendation
- There will be User-User Based Collaborative Filtering, in which, we will recommend top n users for each offer.
- We will use ML to make a content-based recommendation for new users. We will train a model based on demographic data to predict the mean expenditure. Depending on that value, we will recommend offers.
For Informational offers,
- We will use rank-based recommendations. Since there are only two offers in this category, we will just predict top n users for similar new offers.
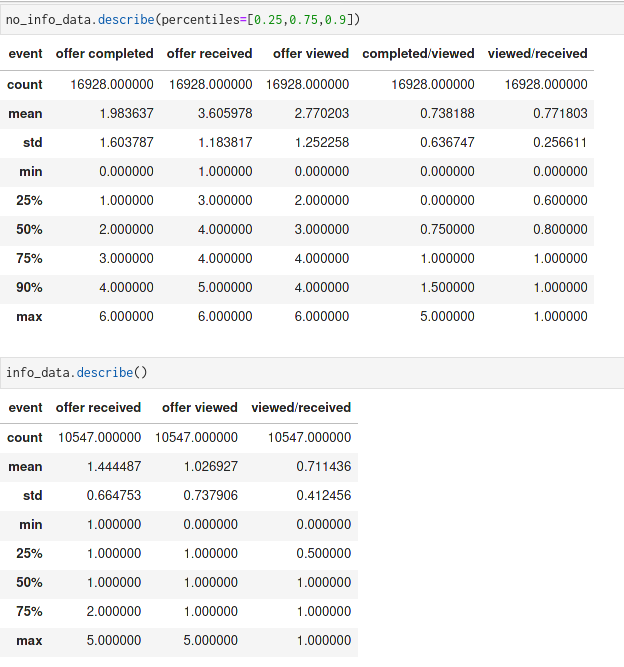
Let’s have a look at informational offer data and BOGO/discount offer data.

Now, from the above table if we look at the completed/viewed and viewed/received data column in ‘no_info_data’ and look at viewed/received data column in ‘info_data’ we can have an estimate of the threshold value to use.
- no_info_data: completed/viewed has a mean of 0.74 and 1.5 is the 90th percentile of the data. viewed/received has a mean of 0.77 and 1 is the 90th percentile of the data.
- info_data: viewed/received has a mean of 0.71 and 1 is the 75th percentile of the data.
Rank-based recommendation:
In this method, we will return n top person for BOGO/discount offers and n top person for informational offers. They will be qualified for future similar offers.
To get n top non-info users first we will filter out users according to certain threshold values in ‘viewed/received’ and ‘completed/viewed’ columns. Then we will look at their mean transaction value. If the value is greater than 20 then we will discard that user, as the greatest offer is a $5 discount on a $20 purchase. So the user doesn’t care about the offers.
For BOGO/Discount offer:
get_n_top_info_user(topn = 5)
>>> array(['23d67a23296a485781e69c109a10a1cf',
       '6dba14f698ae4030ab7354cd5cfe7119',
       'eece6a9a7bdd4ea1b0f812f34fc619d6',
       '05bbe7decb6d43b684221df448979612',
       '116b28e2983c44039eb8b20292742c94'], dtype=object)
For Informational offer:
get_n_top_non_info_user(topn = 5)
>>> array(['d167940f7af04f4681daaa6d1bfd80a1',
       'a2633655a62e4287a3b651d926a774a6',
       '4d4216b868fe43ddb9c9f0b77212c0cb',
       'bb465e90882143b6a49f99d9d810dc3f',
       '17b29dcb0f924294a0d1de2ca59c763f'], dtype=object)
User-User Based Collaborative Filtering for BOGO/Discount data
Now that we have created a rank-based recommendation for new offers, what if we want to send out the existing offers to our existing users who haven’t received some offers yet?
We will try to find top n users for each existing offer. To do so we will create a user_item matrix.
- We will reformat the offer_data data frame to be shaped with users as the columns and offers as the rows.
- Each user should only appear in each column once.
- Each offer should only show up in one row.
- If a user has interacted with an offer, then place a 1 where the user-column meets for that offer row. It does not matter how many times a user has interacted with the offer, all entries where a user has interacted with an offer should be a 1.
- If a user has not interacted with an offer, then place a zero where the user-column meets for that offer row.
We will write a function, which should take a person and provide an ordered list of the most similar users to that user (from most similar to least similar). The returned result should not contain the provided person, as we know that each user is similar to them. Because the results for each user here are binary, it (perhaps) makes sense to compute similarity as the dot product of two users.
find_similar_offers('9b98b8c7a33c4b65b9aebfe6a799e6d9')[:5]
>>> ['3f207df678b143eea3cee63160fa8bed',
 '5a8bc65990b245e5a138643cd4eb9837',
 'ae264e3637204a6fb9bb56bc8210ddfd',
 '4d5c57ea9a6940dd891ad53e9dbe8da0',
 'fafdcd668e3743c1bb461111dcafc2a4']
Finally, to make a recommendation, we’ll use the following code:
offer_offer_recs('3f207df678b143eea3cee63160fa8bed', m=10)
>>> ['0020ccbbb6d84e358d3414a3ff76cffd',
 '005500a7188546ff8a767329a2f7c76a',
 '0063def0f9c14bc4805322a488839b32',
 '00857b24b13f4fe0ad17b605f00357f5',
 '0092a132ead946ceb30d11a1ed513d20',
 '00ad4c2cace94f67a6354ec90d6c6f45',
 '00b5fb9d842d437e83033ad9e36f7148',
 '00b901d68f8f4fd68075184cd0f772d2',
 '00bbce6533f44ddeaf4dd32bcab55441',
 '00bc983061d3471e8c8e74d31b7c8b6f']
offer_offer_recs will give us n number of users who haven’t received a particular offer.
We can improve the recommendation in combination with the ranked-based recommendation.
- Instead of arbitrarily choosing when we obtain offers that are all the same closeness to a given offer — choose the offers that have the most total people interactions before choosing those with fewer people interactions.
- Instead of arbitrarily choosing users from the offer where the number of recommended persons starts below m and ends exceeding m, choose persons with the most total interactions before choosing those with fewer total interactions.
offer_offer_recs_improved('3f207df678b143eea3cee63160fa8bed')
>>> ['0020c2b971eb4e9188eac86d93036a77',
 '00426fe3ffde4c6b9cb9ad6d077a13ea',
 '004c5799adbf42868b9cff0396190900',
 '0099bf30e4cb4265875266eb3eb25eab',
 '00b18b535d6d4f779dea4dc9ac451478',
 '00b5fb9d842d437e83033ad9e36f7148',
 '00b901d68f8f4fd68075184cd0f772d2',
 '00bbce6533f44ddeaf4dd32bcab55441',
 '00bc42a62f884b41a13cc595856cf7c3',
 '00c2f812f4604c8893152a5c6572030e']
Now, since we have built a recommendation system that recommends n persons for each offer, we can improve it further in combination with a ranked-based recommendation. We used some filtering to get top n persons for the informational offer and BOGO/discount offer. In get_n_top_non_info_user, get_n_top_info_user functions, if we set topn = ‘max’ we will get all possible users.
Finally, combine the offer_offer_recs_improved function to get n top persons within the database created by the above-mentioned functions.
make_recs('4d5c57ea9a6940dd891ad53e9dbe8da0')
>>> array(['0009655768c64bdeb2e877511632db8f',
       '0011e0d4e6b944f998e987f904e8c1e5',
       '003d66b6608740288d6cc97a6903f4f0',
       '004b041fbfe44859945daa2c7f79ee64',
       '0056df74b63b4298809f0b375a304cf4',
       '0082fd87c18f45f2be70dbcbb0fb8aad',
       '00c6035df45840038a72766c6d27a0db',
       '0009655768c64bdeb2e877511632db8f',
       '0011e0d4e6b944f998e987f904e8c1e5',
       '003d66b6608740288d6cc97a6903f4f0'], dtype=object)
make_recs function above returning top 10 recommended users for coupon: ‘4d5c57ea9a6940dd891ad53e9dbe8da0'
2. How to recommend coupons/offers to new customers?
Use ML to make a content-based recommendation for new users.
To train an ML model we will use “transaction_data”.
- We want to predict the value column, given the demographic information.
- In this data, ‘person’, ‘event’, ‘time’, and ‘date’ column is not necessary.
- we will group the data by ‘person’ and try to predict the median value. Since a person can occasionally spend more or less than the usual amount, we are removing those outliers by taking the median.
Data Preprocessing:
How did I handle the NaN values? From the analysis so far, we know that there are some rows with no demographic information. These rows have age = 118, gender = Unknown and income = NaN.
Since we know, these NaN values are correlated with no information. So we can treat them as outliers, we can simply filter out the value and calculate the median expenditure and use that value if a new customer doesn’t provide any demographic data.
A look at the data:
X_data.head(10) # target variable
>>>
   gender       income       age
0       M       72000.0       33
1       O       57000.0       40
2       F       90000.0       59
3       F       60000.0       24
4       F       73000.0       26
5       F       65000.0       19
6       F       74000.0       55
7       M       99000.0       54
8       M       47000.0       56
9       M       91000.0       54
Here ‘gender’ is a categorical variable with F (female), M (male), O (other) categories. ‘income’ and ‘age’ are numerical data.
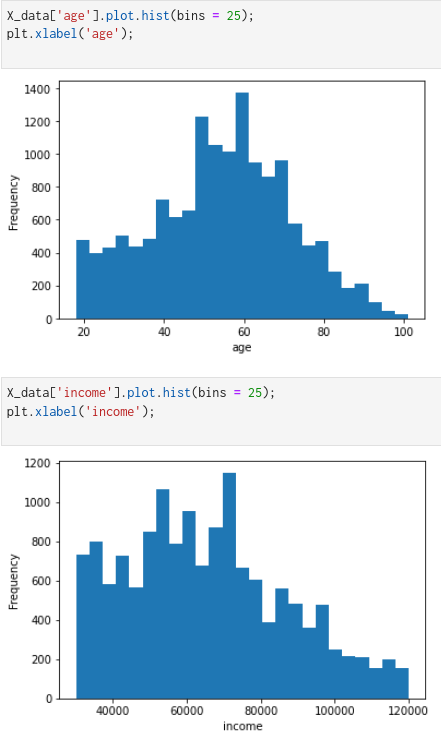
From the plots of numerical columns, we see that the ‘age’ and ‘income’ columns are right-skewed. To make it gaussian, we will do a log transformation followed by standardizing the data to have a 0 mean value.
For the categorical column, ‘gender’ we will use a one-hot encoding.
I used the scikit-learn pipeline to perform data preprocessing.
Since we had only three features, I used PolynomialFeatures from scikit-learn to add more features. Details on how this works can be found here.
For the target variable, I clipped the upper value to 25. Since, if a person spends more than $25, we won’t be sending any offers to them.
Train an ML model
Since this is a regression problem, we can use various regression methods to find the best model.
I used:
- Linear Regression
- Random Forest Regression
- SVM Regressor
- XGBoost regressor
After using these 4 methods, XGBoost gave me a better result, so I decided to use it as my final model.
Matrics:
We cannot calculate the accuracy of a regression model. We can only measure the performance in terms of the prediction error. In our case, we don’t want to predict the exact dollar amount but we want to see how close our predictions are to the actual value. I will use 3 matrics for evaluating my model.
- R square: a measure of how much the dependent variable fits with the model.
- Root mean squared error (RMSE): the sum of square error helps to choose the best regression model. MSE gives larger penalization to big deviation.
- Mean absolute error (MAE): Similar to MSE/RMSE, but instead of taking squared error, it calculated the absolute error. MAE treats every error the same.
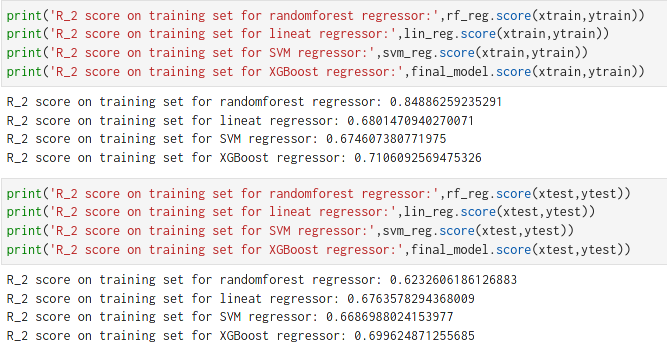

The R square score for XGBoost is 72–70 % which means the model is pretty robust.
Hyperparameter Tuning:
As a final step, we need to tune the hyperparameters to get the best parameter values.
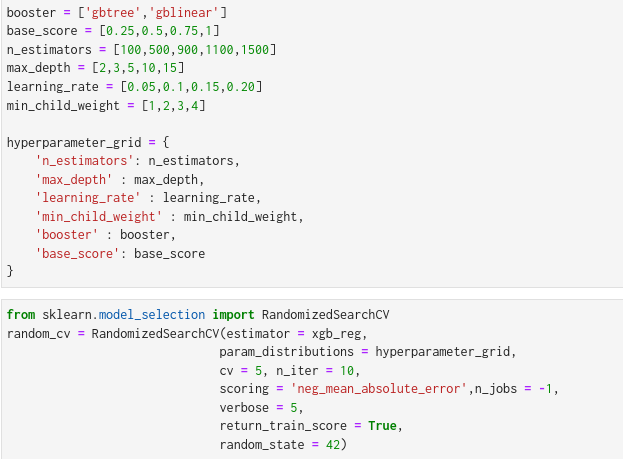
I used scikit-learn’s RandomizedSearchCV to find the best parameter values.
Hyperparameters tuned for this problem is:
Model Evaluation and Validation:
The best parameters are:
random_cv.best_estimator_
>>> XGBRegressor(base_score=0.5, booster='gbtree',    colsample_bylevel=1,
             colsample_bynode=1, colsample_bytree=1, gamma=0, gpu_id=-1,
             importance_type='gain', interaction_constraints='',
             learning_rate=0.2, max_delta_step=0, max_depth=3,
             min_child_weight=3, missing=nan, monotone_constraints='()',
             n_estimators=100, n_jobs=8, num_parallel_tree=1, random_state=0,
             reg_alpha=0, reg_lambda=1, scale_pos_weight=1, subsample=1,
             tree_method='exact', validate_parameters=1, verbosity=None)
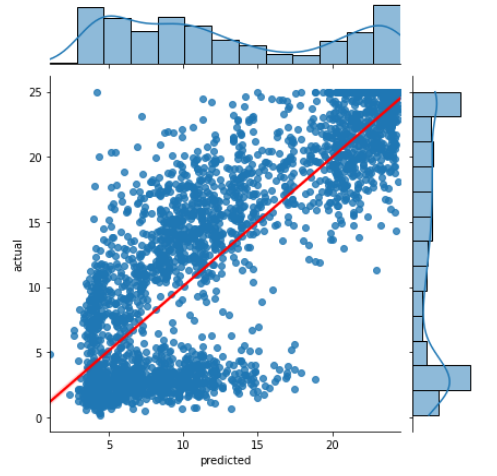
To evaluate if the XGBoost model is stable over all the data or not, we can use K-FOLD CROSS VALIDATION.

As we see the model is pretty stable over the entire data set with a standard deviation of 0.1.
Finally, we can set a rule for sending out coupons to new users.
- A person with no demographic data is expected to spend $1.71, so we can send out an Informational offer or No offer!
- If a user is expected to spend < $3 or >$22, send out an Informational offer or No offer!
- If a user is expected to spend ≥ $3 and <$5, send out the $5 coupon offers.
- If a user is expected to spend ≥ $5 and < $7, send out the $7 coupon offer.
- If a user is expected to spend ≥ $7 and < $10, send out the $10 coupons.
- Lastly, If a user is expected to spend ≥$10 and < $20, send out the $20 coupon.
Example:
person_demo = {
    'gender' : ['M','F','O'],
    'income' : [60000.0,72000.0,80000.0],
    'age' : [36,26,30]
}
predict_expense(person_demo, final_model)
>>> array([ 3.78, 10.66, 22.26], dtype=float32)
- Person 1: gender = Male, income = 60000.00, age = 36. Expected to spend $3.78, so send out a $5 coupon.
- Person 2: gender = Female, income = 72000.00, age = 26. Expected to spend $10.66, so send out a $20 coupon.
- Person 3: gender = Other, income = 80000.00, age = 30. Expected to spend $22.26, so send out a Informational coupon/no coupon at all!
Summary
In summary,
- I created a rank-based recommendation system to filter out top potential users who have a high chance of viewing and redeeming an existing or future offer.
- I used a user-user-based collaborative filtering method to find out the top potential users specific to an offer.
- Finally, I used the Machine Learning approach to recommend offers to new users.
Justification of the Project
I tried to answer 3 questions through this project.
For Question 1. What are the popular types of offers?
From the plots in part 1, the possible answer is,
- I made a plot of a percentage of offers received vs offer type to show, even though BOGO offers were viewed more, Discount offers were more popular in terms of completion.
- I created a plot of the distribution of offers among gender to conclude, given an offer, the chance of redeeming the offer is higher among Females and Other genders!
- Finally, I made plots of gender, age, income vs average spending and found out that women tend to spend the most, and spending increases with age and income.
For Question 2. How to recommend coupons/offers to current customers based on their spending pattern?
- I used a rank-based recommendation system to filter out top potential users who have a high chance of viewing and redeeming an existing or future offer.
- I created a user-user-based collaborative filtering method to find out the top potential users specific to an offer.
For Question 3. How to recommend coupons/offers to new customers?
- I used various matrics(MAE/RMSE) to verify the robustness of the model. I found the RMSE to be ~ 4.5. Although, it’s not enough to differentiate between a $5 offer to a $7 offer, or between a $7 offer to a $10 offer, but there is only one $7 offer, two $5 offers, and four $10 offers. So, It’s more important to separate between a $5 offer to a $10 offer. And for that, the RMSE score is sufficient.
- This method is useful to recommend offers to new users.
Future Work
In the future,
- I am planning to deploy the model and build a data dashboard on the web.
- I will try to improve the model performance by performing more feature engineering. Synthetic Minority Oversampling Technique(SMOT) to increase training data.
- Use CatBoost and LightGBM models to try and check the results.
- Use stacking, since multiple supervised learning models are used.
The GitHub repository of this project can be found here.
References:
- https://www.udacity.com/course/data-scientist-nanodegree–nd025
- https://scikit-learn.org/stable/
- https://xgboost.readthedocs.io/en/latest/
- https://harshit-tyagi.medium.com/end-to-end-machine-learning-project-tutorial-part-1-ea6de9710c0
- https://www.youtube.com/watch?v=vtm35gVP8JU
- https://www.kaggle.com/arthurtok/introduction-to-ensembling-stacking-in-python
Starbucks Sales Analysis — Part 2 was originally published in Towards AI on Medium, where people are continuing the conversation by highlighting and responding to this story.
Join thousands of data leaders on the AI newsletter. It’s free, we don’t spam, and we never share your email address. Keep up to date with the latest work in AI. From research to projects and ideas. If you are building an AI startup, an AI-related product, or a service, we invite you to consider becoming a sponsor.
Published via Towards AI
Take our 90+ lesson From Beginner to Advanced LLM Developer Certification: From choosing a project to deploying a working product this is the most comprehensive and practical LLM course out there!
Towards AI has published Building LLMs for Production—our 470+ page guide to mastering LLMs with practical projects and expert insights!

Discover Your Dream AI Career at Towards AI Jobs
Towards AI has built a jobs board tailored specifically to Machine Learning and Data Science Jobs and Skills. Our software searches for live AI jobs each hour, labels and categorises them and makes them easily searchable. Explore over 40,000 live jobs today with Towards AI Jobs!
Note: Content contains the views of the contributing authors and not Towards AI.


