


Productivity Prediction of Employees using Machine Learning Python
Last Updated on September 24, 2022 by Editorial Team
Author(s): Muttineni Sai Rohith
Originally published on Towards AI the World’s Leading AI and Technology News and Media Company. If you are building an AI-related product or service, we invite you to consider becoming an AI sponsor. At Towards AI, we help scale AI and technology startups. Let us help you unleash your technology to the masses.
Often in industries, it is important to analyze, track and predict the productivity of employees as the companies rely on the productivity and performance of their workers. Also, various factors play a key role in affecting the productivity of employees like incentives given, the domain in which they are working, working hours, day — as people often believe it plays a huge role, the team they are working in and many other features. As companies need good productivity of employees, they need to analyze and take care of these features.
In this article, we are going to predict the productivity of Employees based on various features.
Dataset
The Dataset used in this article is taken from Kaggle. We can find the dataset here. This Dataset consists of information on 1197 employees working in the Garment Industry. The features used in this Dataset are —
The dataset contains 1197 rows and 15 columns
import pandas as pd
df = pd.read_csv("garments_worker_productivity.csv")
df.head(5)
Attribute Information:
date: Date in MM-DD-YYYY
day: Day of the Week
quarter: A portion of the month. A month was divided into four quarters
department: Associated department with the instance
teamno: Associated team number with the instance
noofworkers: Number of workers in each team
noofstylechange: Number of changes in the style of a particular product
targetedproductivity: Targeted productivity set by the Authority for each team for each day.
smv: Standard Minute Value, it is the allocated time for a task
WIP: Work in progress. Includes the number of unfinished items for products
overtime: Represents the amount of overtime by each team in minutes
incentive: Represents the amount of financial incentive (in BDT) that enables or motivates a particular course of action.
idletime: The amount of time when the production was interrupted due to several reasons
idlemen: The number of workers who were idle due to production interruption
actual_productivity: The actual % of productivity that was delivered by the workers. It ranges from 0–1.
EDA
Let’s perform some Data Analysis
Convert date string column to Date object —
df["date"] = pd.to_datetime(df["date"])
Let’s see the types of departments —
df['department'].value_counts()
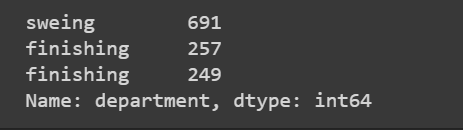
Here we can see that space in the finishing split it into two different categories. Now let’s merge them.
df['department'] = df['department'].apply(lambda x: 'finishing' if x.replace(" ","") == 'finishing' else 'sewing' )
df.department.value_counts().plot.pie(autopct='%.2f %%')
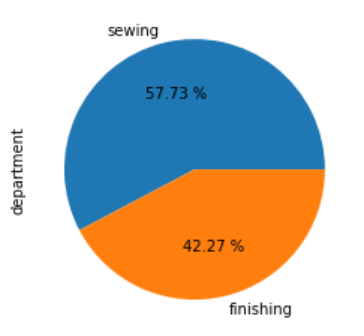
As we can see, 58% of employees work in sewing while 42% are in finishing.
Let’s compare the actual productivity and target productivity to see the performance of employees.
import seaborn as sns
import matplotlib.pyplot as plt
plt.figure(figsize = (15,5))
ax=sns.lineplot(y='targeted_productivity',x='date' ,color = "red", data =df,legend='brief')
ax=sns.lineplot(y= 'actual_productivity',x='date',data=df, color="green", legend = 'brief')
ax.set(ylabel = 'Productivity')
plt.show()
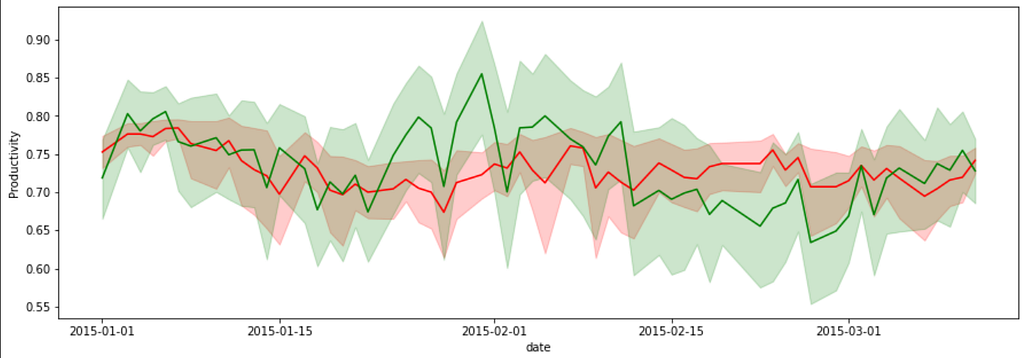
As we can see, the tradeoff is not that consistent, but overall productivity is on the line.
Now Let’s analyze whether the particular day of the week or team or department has any significant effect on productivity.
l = []
l1=[]
column_name = "day"
for i in list(df[column_name].unique()):
print( f"productivity on {i} is ",df[df[column_name] == i]["actual_productivity"].mean())
l.append(df[df[column_name] == i]["actual_productivity"].mean())
l1.append(i)
dictionary = {"data":l,"keys":l1}
sns.barplot( x = "keys" , y = "data", data = dictionary)
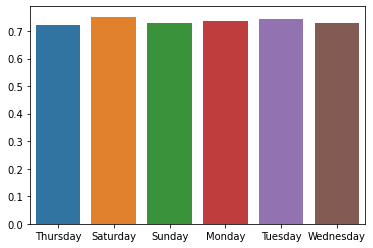
We can see productivity is constant across the number of days. Let’s repeat the same process for other features by replacing column_name with the targeted column name in the above code —
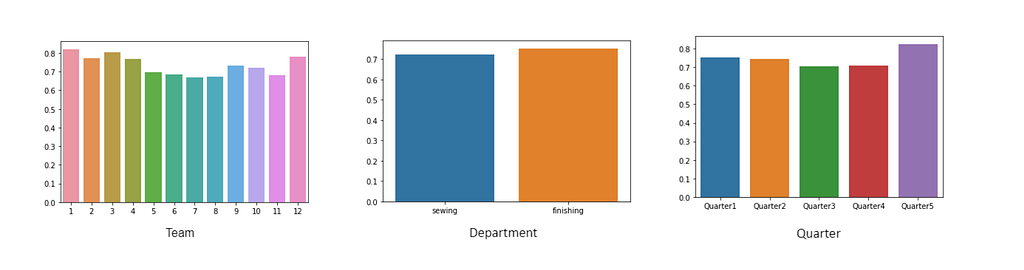
As we can see above, productivity does not depend on the team, category, Quarter, or day.
Let’s plot the correlation Matrix to see the amount of correlation —
corrMatrix = df.corr()
fig, ax = plt.subplots(figsize=(15,15)) # Sample figsize in inches
sns.heatmap(corrMatrix, annot=True, linewidths=.5, ax=ax)
plt.show()
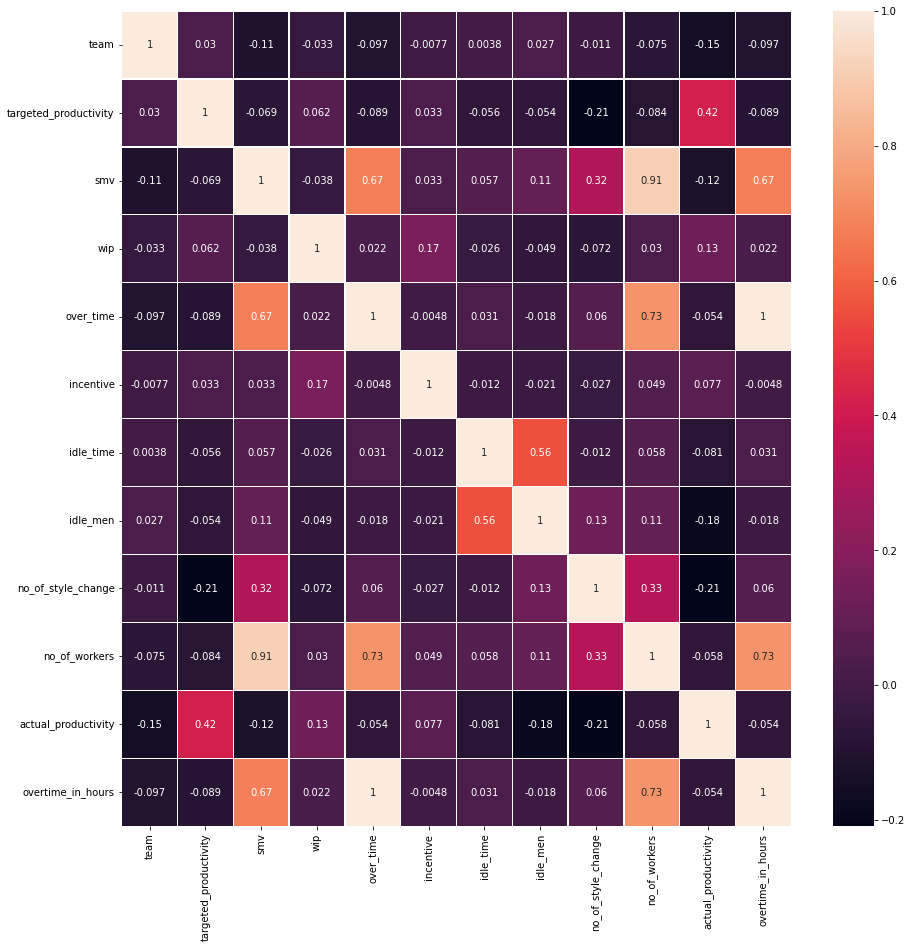
So from these data, it is quite evident productivity mainly depends on the target productivity as having a target will motivate and boost the employees.
Let’s Prepare the final data and start the prediction.
Preprocessing Data
Let’s make some data cleaning and preprocessing before going for the prediction
df.date
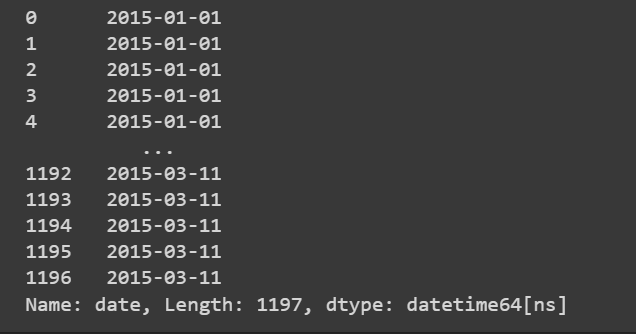
So the data we have is for 3 months. In the data, we already have a day column, so having a month column will suffice instead of the complete date.
df['month']=df['date'].dt.month
df.drop(['date'],axis=1, inplace=True)
Now let’s see whether we have any missing values —
# This will Display the percentage of missing values per column
df.isnull().sum() / len(df) * 100
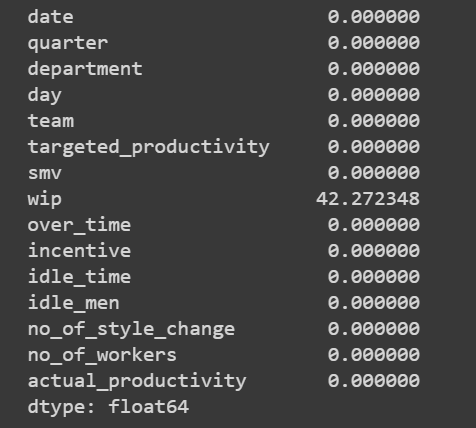
So we have only one column — wip and it has 42% missing values. As of now, Instead of filling it, let’s remove this column.
df.drop(['wip'],axis=1, inplace=True)
In the data, you can see a few non-numerical columns. So let’s encode them as most machine learning algorithms work only with numerical data.
Let’s encode the data with MultiColumnLabelEncoder —
!pip install MultiColumnLabelEncoder
Here we have used MultiColumnLabelEncoder as it is most helpful in inversing the encoding.
import MultiColumnLabelEncoder
Mcle = MultiColumnLabelEncoder.MultiColumnLabelEncoder()
df = Mcle.fit_transform(df)
So our Data is ready. Let’s split the data into independent and dependent columns —
x=df.drop(['actual_productivity'],axis=1)
y=df['actual_productivity']
Predicting the Productivity
Let’s predict productivity using regression algorithms in Python. Before that, let’s prepare training and testing data —
from sklearn.model_selection import train_test_split
x_train, x_test, y_train, y_test = train_test_split(x, y,train_size=0.8,random_state=0)
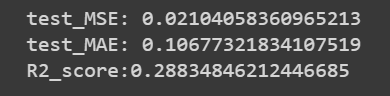
Using LinearRegression
from sklearn.linear_model import LinearRegression
from sklearn.metrics import mean_squared_error
from sklearn.metrics import mean_absolute_error
from sklearn.metrics import r2_score
model_lr=LinearRegression()
model_lr.fit(x_train,y_train)
pred_test=model_lr.predict(x_test)
print("test_MSE:",mean_squared_error(y_test, pred_test))
print("test_MAE:",mean_absolute_error(y_test, pred_test))
print("R2_score:{}".format(r2_score(y_test, pred_test)))
Let’s improve the performance using Random Forest Regression.
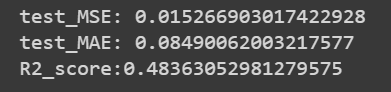
Using Random Forest Regressor
from sklearn.ensemble import RandomForestRegressor
model_rfe = RandomForestRegressor(n_estimators=200,max_depth=5)
model_rfe.fit(x_train, y_train)
pred = model_rfe.predict(x_test)
print("test_MSE:",mean_squared_error(y_test, pred))
print("test_MAE:",mean_absolute_error(y_test, pred))
print("R2_score:{}".format(r2_score(y_test, pred)))
using XGBoost
import xgboost as xgb
model_xgb = xgb.XGBRegressor(n_estimators=200, max_depth=5, learning_rate=0.1)
model_xgb.fit(x_train, y_train)
pred3=model_xgb.predict(x_test)
print("test_MSE:",mean_squared_error(y_test, pred3))
print("test_MAE:",mean_absolute_error(y_test, pred3))
print("R2_score:{}".format(r2_score(y_test, pred3)))
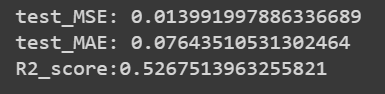
So we have achieved 0.07 — Mean Absolute Error and 0.01 Mean Square error which says our model is performing very well.
So Out of all algorithms, XGBoost has performed well. In this way, we can predict the productivity of employees.
Happy Coding…….
Productivity Prediction of Employees using Machine Learning Python was originally published in Towards AI on Medium, where people are continuing the conversation by highlighting and responding to this story.
Join thousands of data leaders on the AI newsletter. It’s free, we don’t spam, and we never share your email address. Keep up to date with the latest work in AI. From research to projects and ideas. If you are building an AI startup, an AI-related product, or a service, we invite you to consider becoming a sponsor.
Published via Towards AI
Towards AI Academy
We Build Enterprise-Grade AI. We'll Teach You to Master It Too.
15 engineers. 100,000+ students. Towards AI Academy teaches what actually survives production.
Start free — no commitment:
→ 6-Day Agentic AI Engineering Email Guide — one practical lesson per day
→ Agents Architecture Cheatsheet — 3 years of architecture decisions in 6 pages
Our courses:
→ AI Engineering Certification — 90+ lessons from project selection to deployed product. The most comprehensive practical LLM course out there.
→ Agent Engineering Course — Hands on with production agent architectures, memory, routing, and eval frameworks — built from real enterprise engagements.
→ AI for Work — Understand, evaluate, and apply AI for complex work tasks.
Note: Article content contains the views of the contributing authors and not Towards AI.
Related posts
Recent Posts


")

