


One-Line, Magical Code to Perform EDA!
Last Updated on April 24, 2021 by Editorial Team
Author(s): Daksh Trehan
Machine Learning, Exploratory Data Analysis
One line solves all your problems!
“Data is the new oil” ~ Clive Humby
Data is an integral part of our life and unlike other resources it is inexhaustible but here comes a catch, it is only useful to your organization if you know how to mend it and get its gist.
Data Science is a process that includes: Collecting, Storing, Processing, Describing, and Modeling.
Processing, Describing/EDA(Exploratory Data Analysis) can be referred to as a lifecycle to get introduced to the data by finding relations among each variable and visualizing them to find hidden trends.
EDA accounts for a large amount of time and effort to clean and explore our data. Though in the field of data processing we still expect some advancements for Data Exploration there have been astounding improvements. Several open-source libraries have come up with a no-code or low-code method to help ease the exploration.
D-Tale is one such library, it is the combination of Flask back-end and React Front-end that brings up an interactive way to visualize and explore pandas data frame.
D-Tale makes sure you aren’t sick of performing df.head() recursively!
Implementing D-Tale
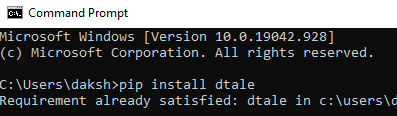
- Install D-Tale: Like any other Python Library you can easily install D-Tale by using “pip install dtale” in your command line.
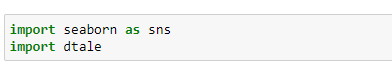
2. Importing Relevant Libraries: Use Seaborn to load dataset and D-tale to visualize and explore.
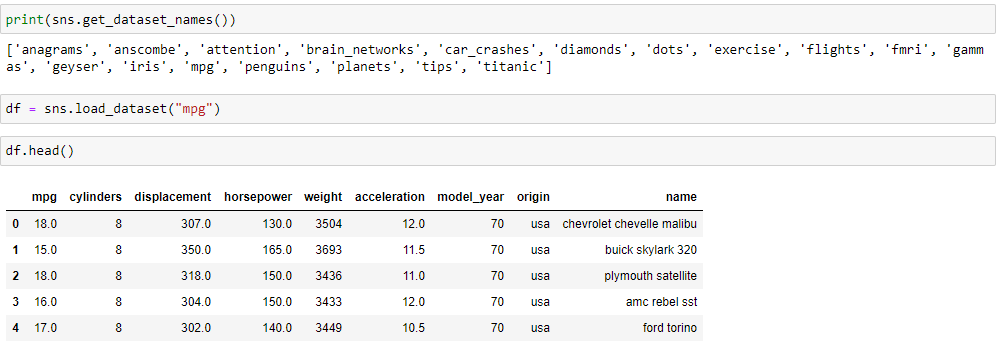
3. Chose a dataset: From pre-defined dataset in Seaborn chose any one.
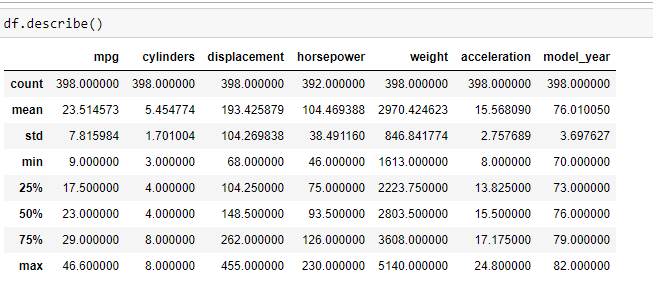
4. Take basic insights of data: Use describe() method for the same.
5. Use D-Tale: Load the data using D-Tale library and get interactive insights.
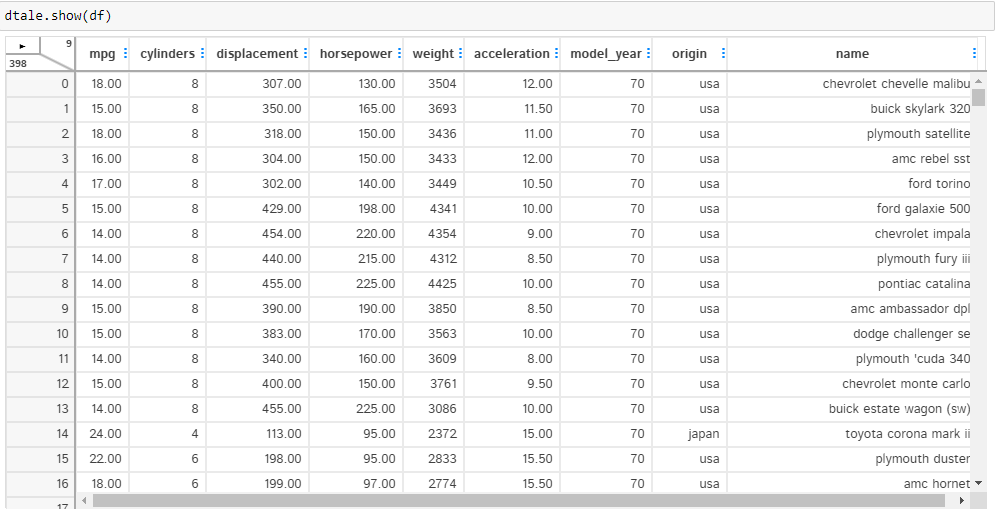
Tap on play button and chose “Open in New Tab”:
Features of D-Tale
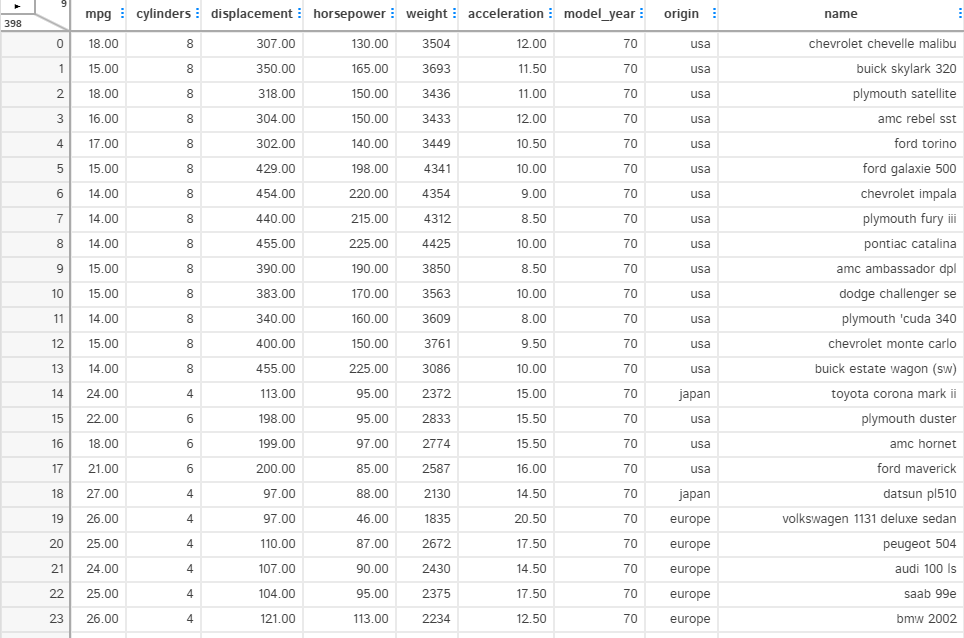
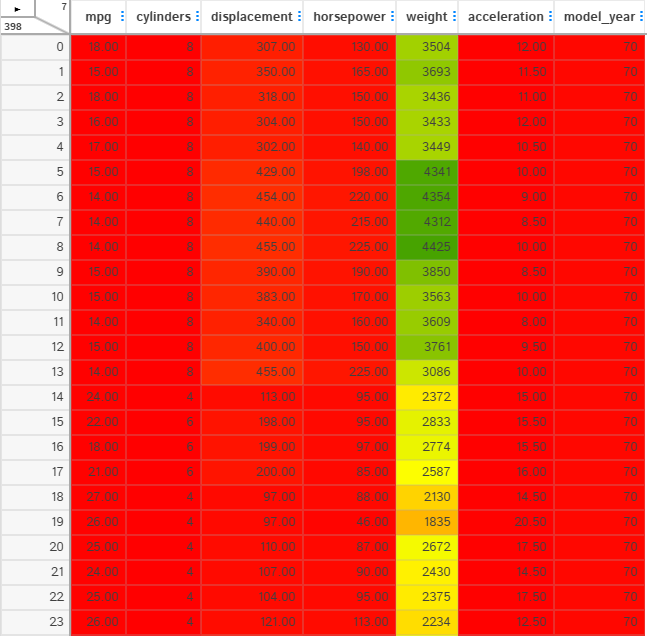
All you Data in clean and elegant way!
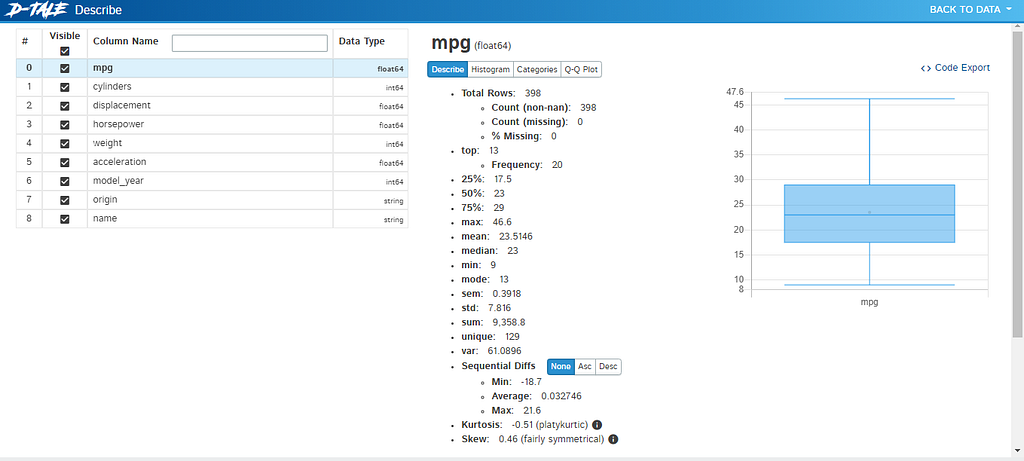
Look for Statistical Property of your dataset using “Describe” button.
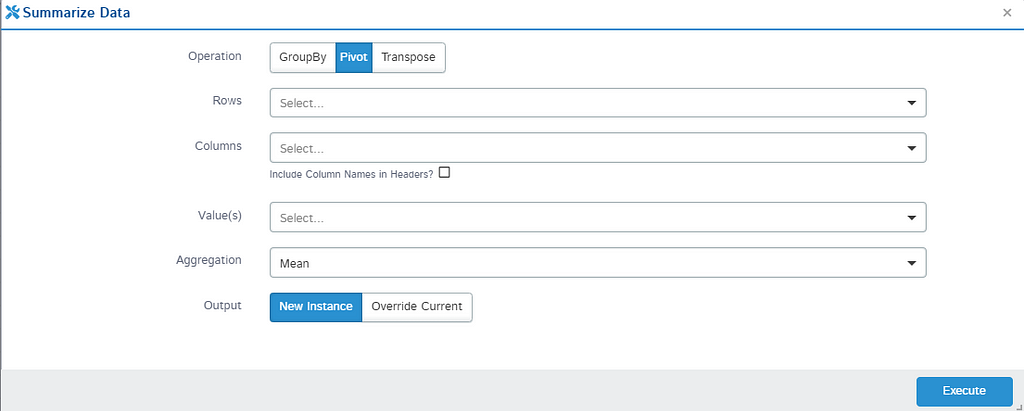
Summarize the data of relevant rows and columns.
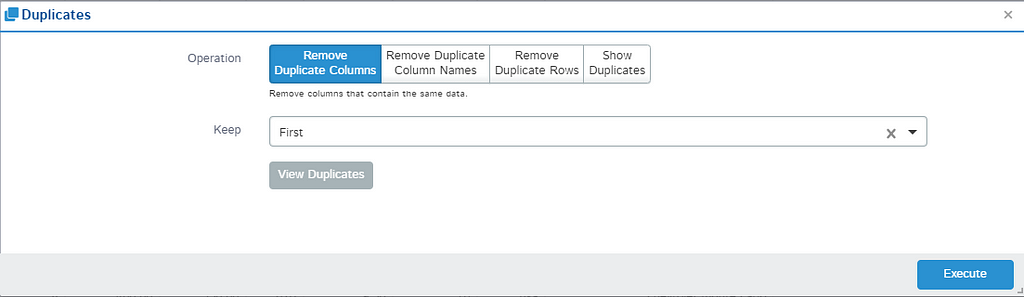
Remove Duplicate Values
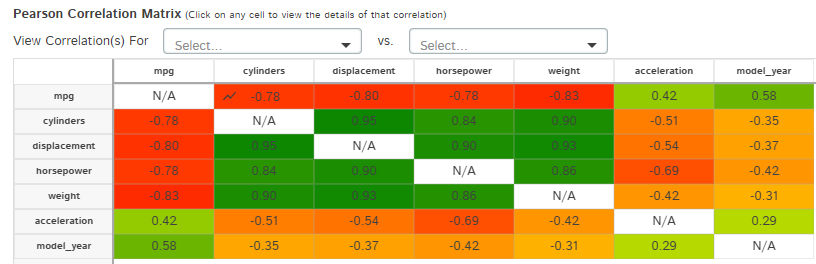
Check the Correlation in your data for easy creation of charts.
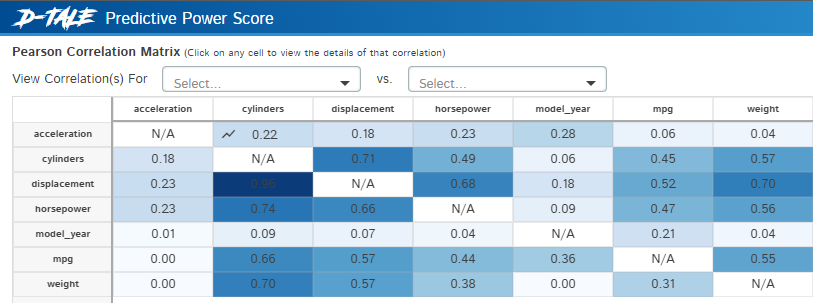
The library helps you with agnostic score that helps to determine linear and non-linear relationship.
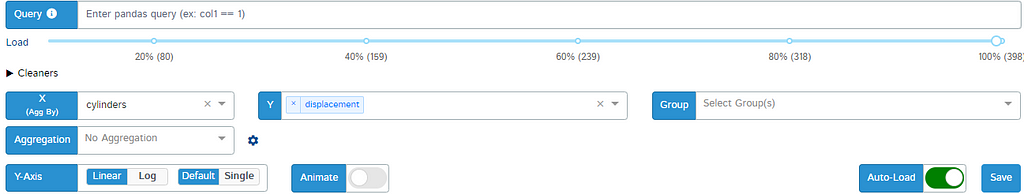
The most anticipating feature of D-Tale is its ability to create charts seamlessly.

It offers a wide variety of charts with data cleaning options that are personalized to each chart type.
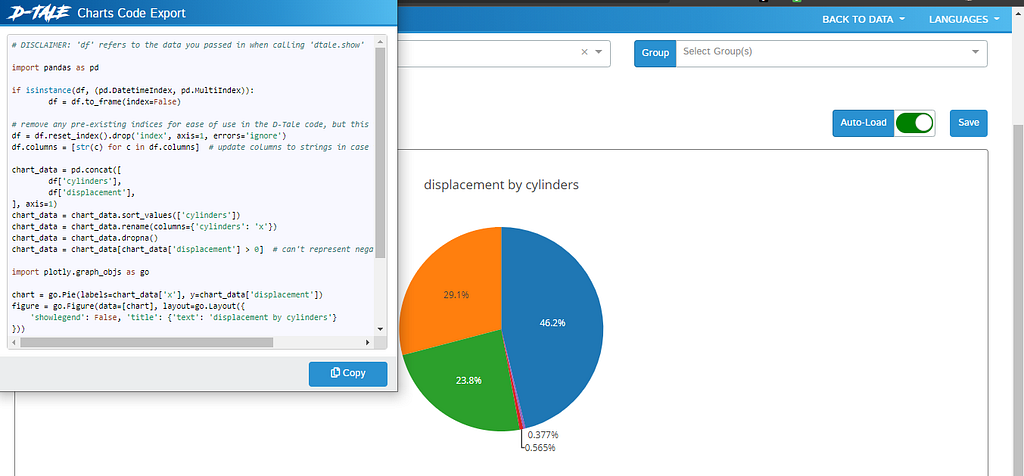
Another highlighting feature of D-Tale is that it allows you to create chart from the dashboard and directly import the code for the same.
Heat maps can also be employed either on whole data or on particular columns.
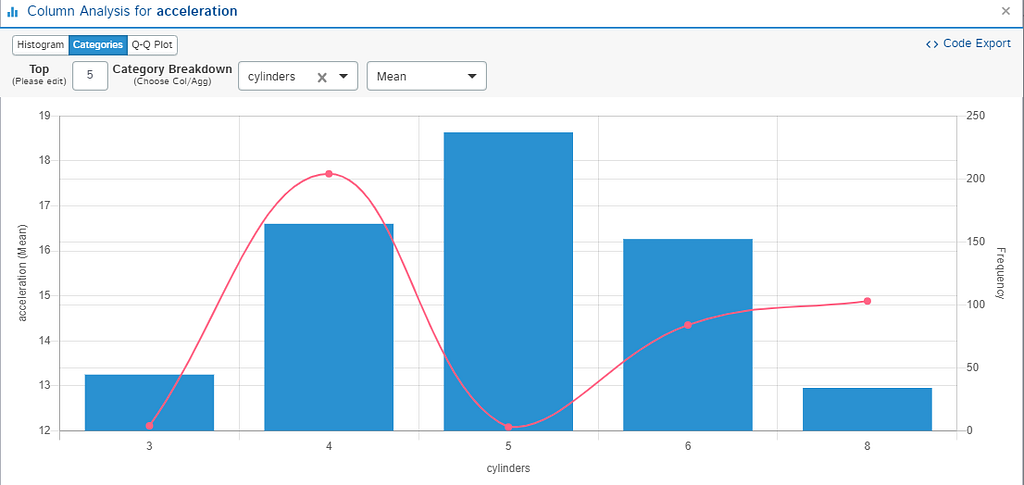
You can also check statistical values for particular column and perform column analysis.
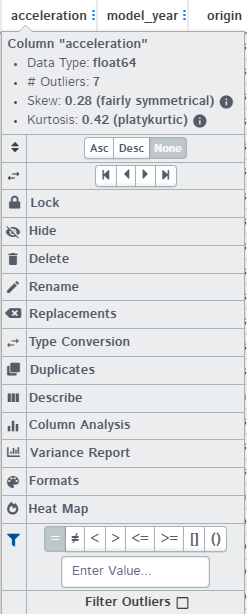
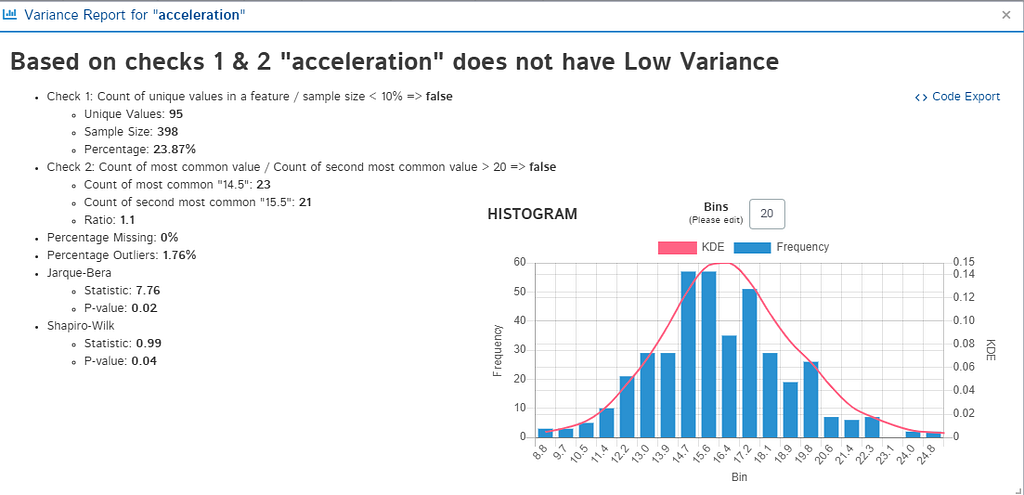
Perform Variance analysis on each column.
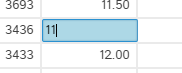
The user can also change the data of any particular record.
The above mentioned code can be found at: dakshtrehan/D-Tale-Exploration (github.com)
Conclusion
The article helped us to throw a light on extremely powerful EDA reporting tool: D-Tale. We saw how D-Tale make it super easy to create appealing visuals and explore the data.
References:
Data Exploration in Python With dtale Library (analyticsvidhya.com)
Bring your Pandas Dataframes to life with D-Tale — KDnuggets
Dtale Tutorial — Guide To Visualize Pandas Data Structure (analyticsindiamag.com)
Social Network for Programmers and Developers (morioh.com)
Feel free to connect:
Portfolio ~ https://www.dakshtrehan.com
LinkedIn ~ https://www.linkedin.com/in/dakshtrehan
Follow for further Machine Learning/ Deep Learning blogs.
Medium ~ https://medium.com/@dakshtrehan
Want to learn more?
Are You Ready to Worship AI Gods?
Detecting COVID-19 Using Deep Learning
The Inescapable AI Algorithm: TikTok
GPT-3 Explained to a 5-year old.
Tinder+AI: A perfect Matchmaking?
An insider’s guide to Cartoonization using Machine Learning
Reinforcing the Science Behind Reinforcement Learning
Decoding science behind Generative Adversarial Networks
Understanding LSTM’s and GRU’s
Recurrent Neural Network for Dummies
Convolution Neural Network for Dummies
Cheers
One-Line, Magical Code to Perform EDA! was originally published in Towards AI on Medium, where people are continuing the conversation by highlighting and responding to this story.
Published via Towards AI
Towards AI Academy
We Build Enterprise-Grade AI. We'll Teach You to Master It Too.
15 engineers. 100,000+ students. Towards AI Academy teaches what actually survives production.
Start free — no commitment:
→ 6-Day Agentic AI Engineering Email Guide — one practical lesson per day
→ Agents Architecture Cheatsheet — 3 years of architecture decisions in 6 pages
Our courses:
→ AI Engineering Certification — 90+ lessons from project selection to deployed product. The most comprehensive practical LLM course out there.
→ Agent Engineering Course — Hands on with production agent architectures, memory, routing, and eval frameworks — built from real enterprise engagements.
→ AI for Work — Understand, evaluate, and apply AI for complex work tasks.
Note: Article content contains the views of the contributing authors and not Towards AI.
Related posts
Recent Posts
")


")


