


Machine Learning Project in Python Step-By-StepCredit Card Fraud Detection
Last Updated on March 14, 2023 by Editorial Team
Author(s): Fares Sayah
Originally published on Towards AI.
Step-By-Step Machine Learning Project in Python — Credit Card Fraud Detection
Demonstration of How to Handle Highly Imbalanced Classification Problems
Three challenges surrounding Credit Card Fraud
- It’s not always easy to agree on the ground truth of what “fraud” means.
- Regardless of how you define ground truth, the vast majority of charges are not fraudulent.
- Most merchants aren’t experts at evaluating the business impact of fraud.
Problem Statement:
The objective of Credit Card Fraud Detection is to accurately identify fraudulent transactions from a large pool of credit card transactions by building a predictive model based on past transaction data. The aim is to detect all fraudulent transactions with minimum false alarms.
Observations
- The dataset is highly imbalanced, with only 0.172% of observations being fraudulent.
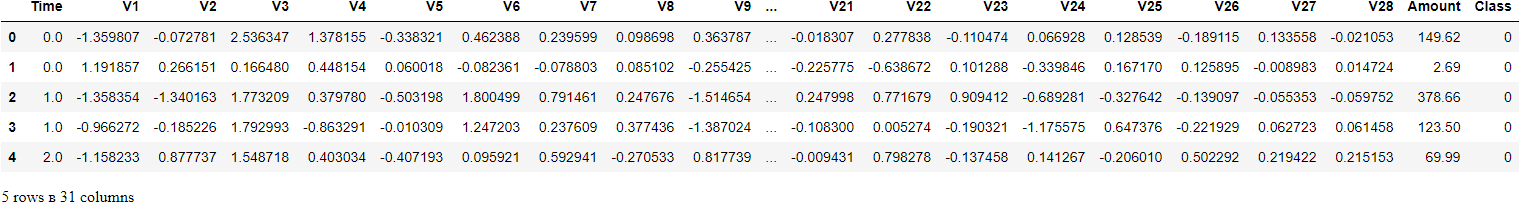
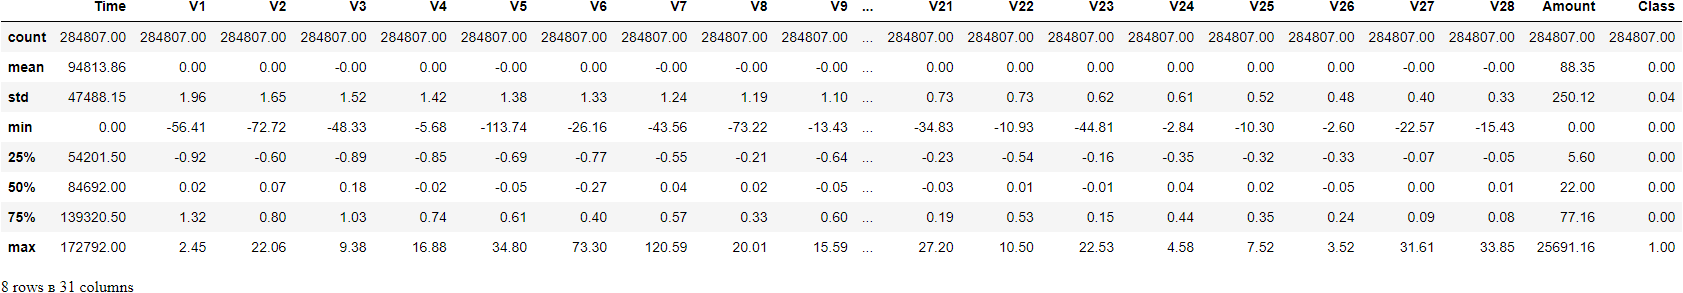
- The dataset consists of 28 transformed features (V1 to V28) and two untransformed features (Time and Amount).
- There is no missing data in the dataset, and no information about the original features is provided.
Why does class imbalance affect model performance?
- In general, we want to maximize the recall while capping FPR (False Positive Rate), but you can classify a lot of charges wrong and still maintain a low FPR because you have a large number of true negatives.
- This is conducive to picking a relatively low threshold, which results in a high recall but extremely low precision.
What is the catch?
- Training a model on a balanced dataset optimizes performance on validation data.
- However, the goal is to optimize performance on the imbalanced production dataset. You ultimately need to find a balance that works best in production.
- One solution to this problem is: Use all fraudulent transactions but subsample non-fraudulent transactions as needed to hit our target rate.
Business questions to brainstorm:
Since all features are anonymous, we will focus our analysis on non-anonymized features: Time, Amount
- How different is the amount of money used in different transaction classes?
- Do fraudulent transactions occur more often during certain frames?
Exploratory Data Analysis — EDA
Let us now check the missing values in the dataset.
0
The only non-transformed variables to work with are:
- Time
- Amount
- Class (1: fraud, 0: not_fraud)
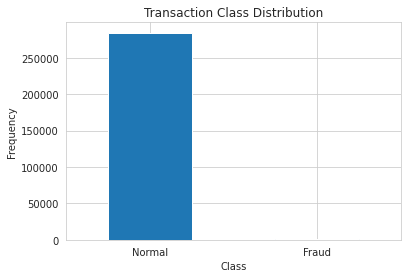
0    284315
1       492
Name: Class, dtype: int64
Notice how imbalanced is our original dataset! Most of the transactions are non-fraud. If we use this DataFrame as the base for our predictive models and analysis, we might get a lot of errors, and our algorithms will probably overfit since they will “assume” that most transactions are not a fraud. But we don’t want our model to assume, we want our model to detect patterns that give signs of fraud!
Determine the number of fraud and valid transactions in the entire dataset.
Shape of Fraudulant transactions: (492, 31)
Shape of Non-Fraudulant transactions: (284315, 31)
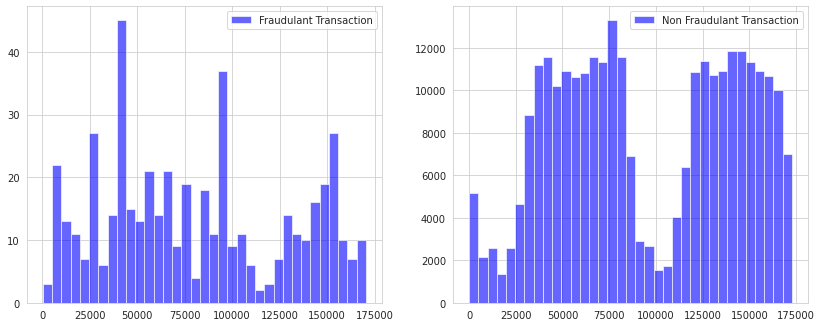
How different is the amount of money used in different transaction classes?

Do fraudulent transactions occur more often during a certain time frame?

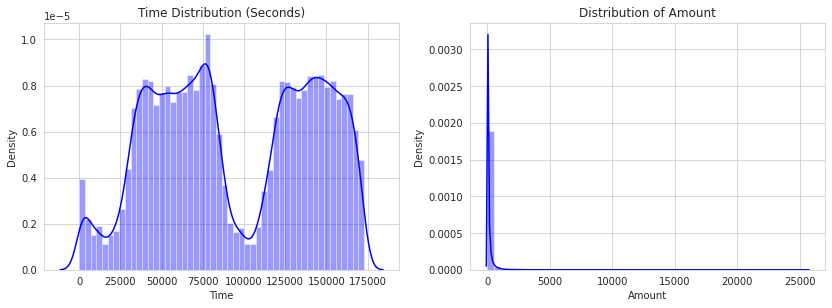
Distributions:
By seeing the distributions, we can have an idea of how skewed these features are, and we can also see further distributions of the other features. There are techniques that can help the distributions be less skewed, which will be implemented in this notebook in the future.
Doesn’t seem like the time of the transaction really matters here, as per the above observation. Now let us take a sample of the dataset for our modeling and prediction.
Correlation Matrices
Correlation matrices are the essence of understanding our data. We want to know if there are features that influence heavily whether a specific transaction is a fraud. However, it is important that we use the correct DataFrame (subsample) in order for us to see which features have a high positive or negative correlation with regard to fraudulent transactions.
Summary and Explanation:
- Negative Correlations: V17, V14, V12, and V10 are negatively correlated. Notice how the lower these values are, the more likely the end result will be a fraudulent transaction.
- Positive Correlations: V2, V4, V11, and V19 are positively correlated. Notice how the higher these values are, the more likely the end result will be a fraudulent transaction.
- BoxPlots: We will use boxplots to have a better understanding of the distribution of these features in fraudulent and non-fraudulent transactions.
Note: We have to make sure we use the subsample in our correlation matrix or else our correlation matrix will be affected by the high imbalance between our classes. This occurs due to the high-class imbalance in the original DataFrame.
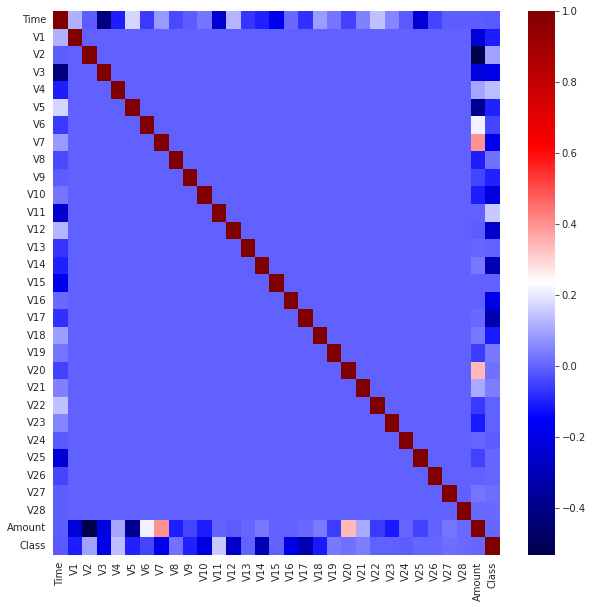
The highest correlations come from:
- Time & V3 (-0.42)
- Amount & V2 (-0.53)
- Amount & V4 (0.4)
Data Pre-processing
Time and Amount should be scaled as the other columns.
Fraudulant transaction weight: 0.0017994745785028623
Non-Fraudulant transaction weight: 0.9982005254214972
TRAINING: X_train: (159491, 30), y_train: (159491,)
_______________________________________________________
VALIDATION: X_validate: (39873, 30), y_validate: (39873,)
__________________________________________________
TESTING: X_test: (85443, 30), y_test: (85443,)
Model Building
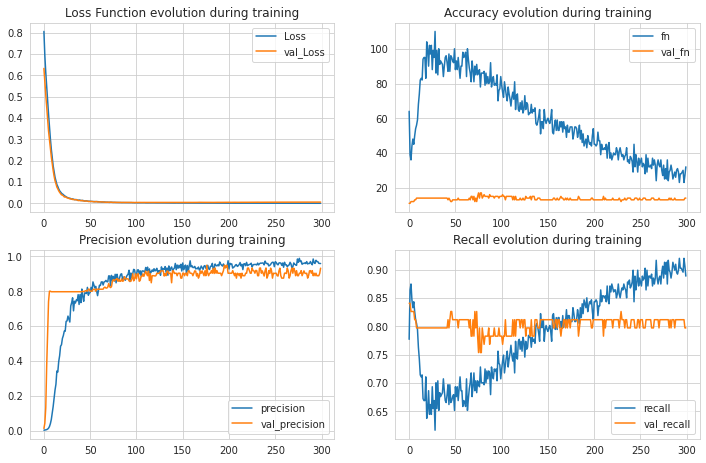
Artificial Neural Networks (ANNs)
2671/2671 [==============================] - 11s 4ms/step - loss: 0.0037 - fn: 29.0000 - fp: 12.0000 - tn: 85295.0000 - tp: 107.0000 - precision: 0.8992 - recall: 0.7868
[0.003686850192025304, 29.0, 12.0, 85295.0, 107.0, 0.8991596698760986, 0.7867646813392639]
Train Result:
================================================
Accuracy Score: 99.99%
_______________________________________________
Classification Report:
                  0      1  accuracy  macro avg  weighted avg
precision      1.00   1.00      1.00       1.00          1.00
recall         1.00   0.95      1.00       0.98          1.00
f1-score       1.00   0.97      1.00       0.99          1.00
support   159204.00 287.00      1.00  159491.00     159491.00
_______________________________________________
Confusion Matrix:
 [[159204      0]
 [    14    273]]

Test Result:
================================================
Accuracy Score: 99.96%
_______________________________________________
Classification Report:
                 0      1  accuracy  macro avg  weighted avg
precision     1.00   0.92      1.00       0.96          1.00
recall        1.00   0.81      1.00       0.90          1.00
f1-score      1.00   0.86      1.00       0.93          1.00
support   85307.00 136.00      1.00   85443.00      85443.00
_______________________________________________
Confusion Matrix:
 [[85298     9]
 [   26   110]]
XGBoost
Train Result:
================================================
Accuracy Score: 100.00%
_______________________________________________
Classification Report:
                  0      1  accuracy  macro avg  weighted avg
precision      1.00   1.00      1.00       1.00          1.00
recall         1.00   1.00      1.00       1.00          1.00
f1-score       1.00   1.00      1.00       1.00          1.00
support   159204.00 287.00      1.00  159491.00     159491.00
_______________________________________________
Confusion Matrix:
 [[159204      0]
 [     0    287]]

Test Result:
================================================
Accuracy Score: 99.96%
_______________________________________________
Classification Report:
                 0      1  accuracy  macro avg  weighted avg
precision     1.00   0.95      1.00       0.97          1.00
recall        1.00   0.82      1.00       0.91          1.00
f1-score      1.00   0.88      1.00       0.94          1.00
support   85307.00 136.00      1.00   85443.00      85443.00
_______________________________________________
Confusion Matrix:
 [[85301     6]
 [   25   111]]
Random Forest
Train Result:
================================================
Accuracy Score: 100.00%
_______________________________________________
Classification Report:
                  0      1  accuracy  macro avg  weighted avg
precision      1.00   1.00      1.00       1.00          1.00
recall         1.00   1.00      1.00       1.00          1.00
f1-score       1.00   1.00      1.00       1.00          1.00
support   159204.00 287.00      1.00  159491.00     159491.00
_______________________________________________
Confusion Matrix:
 [[159204      0]
 [     0    287]]

Test Result:
================================================
Accuracy Score: 99.96%
_______________________________________________
Classification Report:
                 0      1  accuracy  macro avg  weighted avg
precision     1.00   0.91      1.00       0.95          1.00
recall        1.00   0.82      1.00       0.91          1.00
f1-score      1.00   0.86      1.00       0.93          1.00
support   85307.00 136.00      1.00   85443.00      85443.00
_______________________________________________
Confusion Matrix:
 [[85296    11]
 [   25   111]]
CatBoost
Train Result:
================================================
Accuracy Score: 100.00%
_______________________________________________
Classification Report:
                  0      1  accuracy  macro avg  weighted avg
precision      1.00   1.00      1.00       1.00          1.00
recall         1.00   1.00      1.00       1.00          1.00
f1-score       1.00   1.00      1.00       1.00          1.00
support   159204.00 287.00      1.00  159491.00     159491.00
_______________________________________________
Confusion Matrix:
 [[159204      0]
 [     1    286]]

Test Result:
================================================
Accuracy Score: 99.96%
_______________________________________________
Classification Report:
                 0      1  accuracy  macro avg  weighted avg
precision     1.00   0.93      1.00       0.97          1.00
recall        1.00   0.82      1.00       0.91          1.00
f1-score      1.00   0.87      1.00       0.94          1.00
support   85307.00 136.00      1.00   85443.00      85443.00
_______________________________________________
Confusion Matrix:
 [[85299     8]
 [   25   111]]
LigthGBM
Train Result:
================================================
Accuracy Score: 99.58%
_______________________________________________
Classification Report:
                  0      1  accuracy  macro avg  weighted avg
precision      1.00   0.23      1.00       0.62          1.00
recall         1.00   0.59      1.00       0.79          1.00
f1-score       1.00   0.33      1.00       0.67          1.00
support   159204.00 287.00      1.00  159491.00     159491.00
_______________________________________________
Confusion Matrix:
 [[158652    552]
 [   119    168]]

Test Result:
================================================
Accuracy Score: 99.50%
_______________________________________________
Classification Report:
                 0      1  accuracy  macro avg  weighted avg
precision     1.00   0.16      0.99       0.58          1.00
recall        1.00   0.53      0.99       0.76          0.99
f1-score      1.00   0.25      0.99       0.62          1.00
support   85307.00 136.00      0.99   85443.00      85443.00
_______________________________________________
Confusion Matrix:
 [[84942   365]
 [   64    72]]
Model Comparison
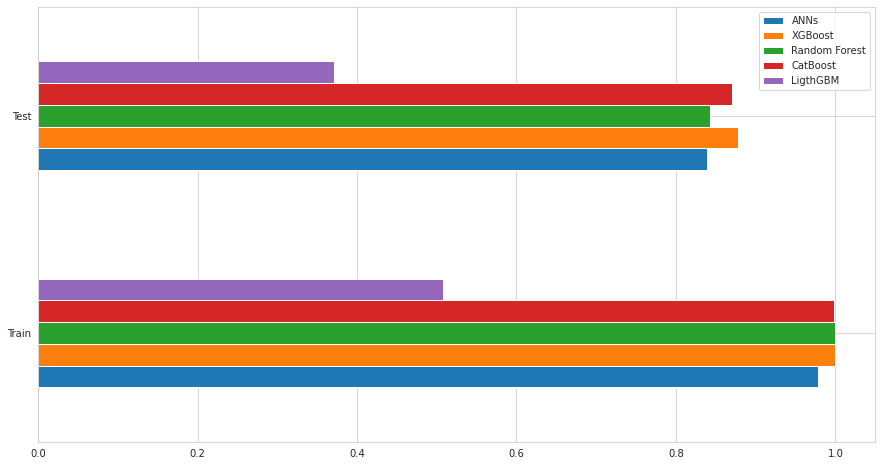
Conclusions:
We learned how to develop our credit card fraud detection model using machine learning. We used a variety of ML algorithms, including ANNs and Tree-based models. At the end of the training, out of 85443 validation transaction, XGBoost performs better than other models:
- Correctly identifying 111 of them as fraudulent
- Missing 9 fraudulent transactions
- At the cost of incorrectly flagging 25 legitimate transactions
Links and Resources:
- Link to data used in this tutorial: Credit Card Fraud Detection
- Link to Full Notebook
Machine Learning Project in Python Step-By-Step — Credit Card Fraud Detection was originally published in Towards AI on Medium, where people are continuing the conversation by highlighting and responding to this story.
Join thousands of data leaders on the AI newsletter. Join over 80,000 subscribers and keep up to date with the latest developments in AI. From research to projects and ideas. If you are building an AI startup, an AI-related product, or a service, we invite you to consider becoming a sponsor.
Published via Towards AI
Towards AI Academy
We Build Enterprise-Grade AI. We'll Teach You to Master It Too.
15 engineers. 100,000+ students. Towards AI Academy teaches what actually survives production.
Start free — no commitment:
→ 6-Day Agentic AI Engineering Email Guide — one practical lesson per day
→ Agents Architecture Cheatsheet — 3 years of architecture decisions in 6 pages
Our courses:
→ AI Engineering Certification — 90+ lessons from project selection to deployed product. The most comprehensive practical LLM course out there.
→ Agent Engineering Course — Hands on with production agent architectures, memory, routing, and eval frameworks — built from real enterprise engagements.
→ AI for Work — Understand, evaluate, and apply AI for complex work tasks.
Note: Article content contains the views of the contributing authors and not Towards AI.
Related posts
Recent Posts
")


")


