


How To Compare 2 Datasets With Pandas-profiling
Last Updated on January 6, 2023 by Editorial Team
Last Updated on November 24, 2022 by Editorial Team
Author(s): Fabiana Clemente
Originally published on Towards AI the World’s Leading AI and Technology News and Media Company. If you are building an AI-related product or service, we invite you to consider becoming an AI sponsor. At Towards AI, we help scale AI and technology startups. Let us help you unleash your technology to the masses.
A data quality use case with advanced EDA
Visualization is the cornerstone of EDA. When facing a new, unknown dataset, visual inspection allows us to get a feel of the available information, draw some patterns regarding the data, and diagnose several issues that we might need to address. In that regard, Pandas Profiling has been the indispensable swiss-knife in every data scientist’s tool belt. In my past articles, I’ve mentioned how pandas profiling can be helpful while performing time-series EDA, but what if we could compare two datasets?
How many of us have started the development of a data science project and struggle to understand how much are we getting from our data transformations and engineering?
And that’s exactly what I’ll be covering in today’s blog post — how to leverage the most famous single line of code EDA to boost the process of data science development and data quality improvements. I’ll give you a tour of how to leverage Pandas-Profiling comparison report functionality to boost your EDA process and illustrate its potential in producing faster and smarter transformations on our data.
The dataset used in this article can be found in Kaggle, the HCC Dataset by Miriam Santos (License: CC0: Public Domain). For this particular use case, I’ve artificially introduced some additional data quality issues to show you how visualization can help us detect them and guide us toward their efficient mitigation. All code and examples are available on GitHub and in case you need a little refresher, make sure to check this blog to dust off your pandas-profiling skills. So, on with our use case!
Pandas Profiling: EDA at your fingertip
We’ll start by profiling the HCC dataset and investigating the data quality issues suggested in the report:
pip install pandas-profiling==3.5.0
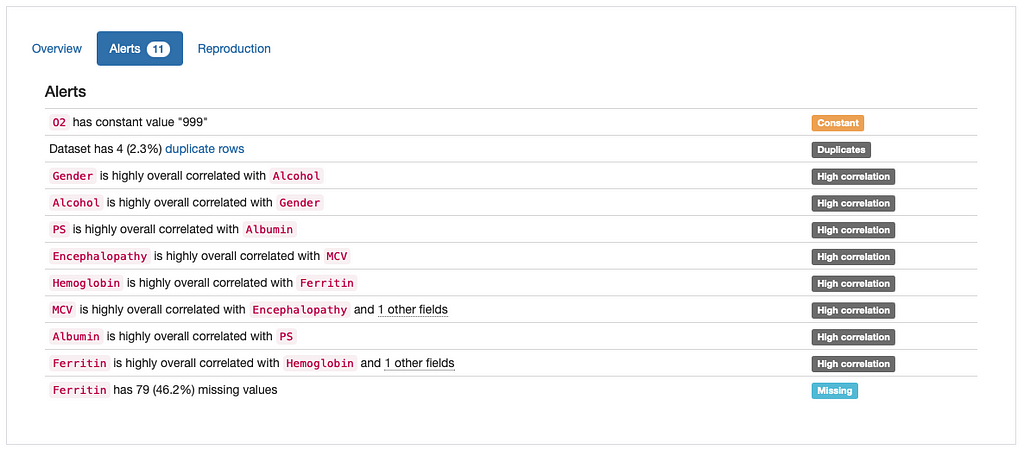
According to the “Alerts” overview, there are four main types of potential issues that need to be addressed:
- Duplicates: 4 duplicate rows in data;
- Constant: Constant value “999” in ‘O2’;
- High Correlation: Several features marked as highly correlated;
- Missing: Missing Values in ‘Ferritin’.
The validity of each potential problem (as well as the need to find a mitigation strategy for it) depends on the specific use case and domain knowledge. In our case, with the exception of the “high correlation” alerts, which would require further investigation, the remaining alerts seem to reflect true data quality issues and can be tackled using a few practical solutions:
Removing Duplicate Rows: Depending on the nature of the domain, there might be records that have the same values without it being an error. However, considering that some of the features in this dataset are quite specific and refer to an individual’s biological measurements (e.g., “Hemoglobin”, “MCV”, “Albumin”), it’s unlikely that several patients report the same exact values for all features. Let’s start by dropping these duplicates from the data:
Removing Irrelevant Features: The constant values in O2 also reflect a true inconsistency in data and do not seem to hold valuable information for model development. In real use case scenarios, it would be a good standard to iterate with a domain or a business experts, but for the purpose of this use case example, we’ll go ahead and drop them from the analysis:
Missing Data Imputation: HCC dataset also seems extremely susceptible to missing data. A simple way to address this issue (avoiding removing incomplete records or entire features) is resorting to data imputation. We’ll use mean imputation to fill in the absent observations, as it is the most common and simple of statistical imputation techniques and often serves as a baseline method:
Side-by-side comparison: faster and smarter iterations on your data
Now for the fun part! After implementing the first batch of transformations to our dataset, we’re ready to assess their impact on the overall quality of our data. This is where the pandas-profiling compare report functionality comes in handy. The code below depicts how to get started:
Here’s how both reports are shown in the comparison:
What can we right away understand from our dataset overview? The transformed dataset contains one less categorical feature (“O2” was removed), 165 observations (versus the original 171 containing duplicates), and no missing values (in contrast with the 79 missing observations in the original dataset).
But how have this transformations impacted the quality of our data? And how good were those decisions?
Let’s dive deep into that. In what concerns duplicate records, there was no particular impact in what concerns variables distributions and dataset patterns after the drop. The missing values imputation that was done is a different story.
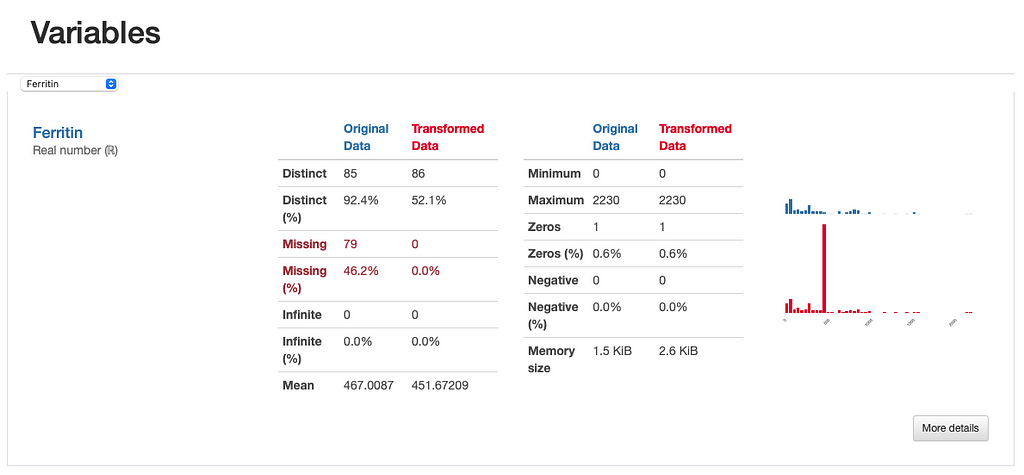
As expected, there are no missing observations after the data imputation was performed. Note how both the nullity count and matrix show the differences between both versions of the data: in the transformed data, “Ferritin” now has 165 complete values, and no blanks can be found in the nullity matrix.
However, we can infer something else from the comparison report. If we were to inspect the “Ferritin” histogram, we’d see how imputing values with the mean has distorted the original data distribution, which is undesirable.
This is also observed through the visualization of interactions and correlations, where daft interaction patterns and higher correlation values emerge in the relationship between “Ferritin” and the remaining features.
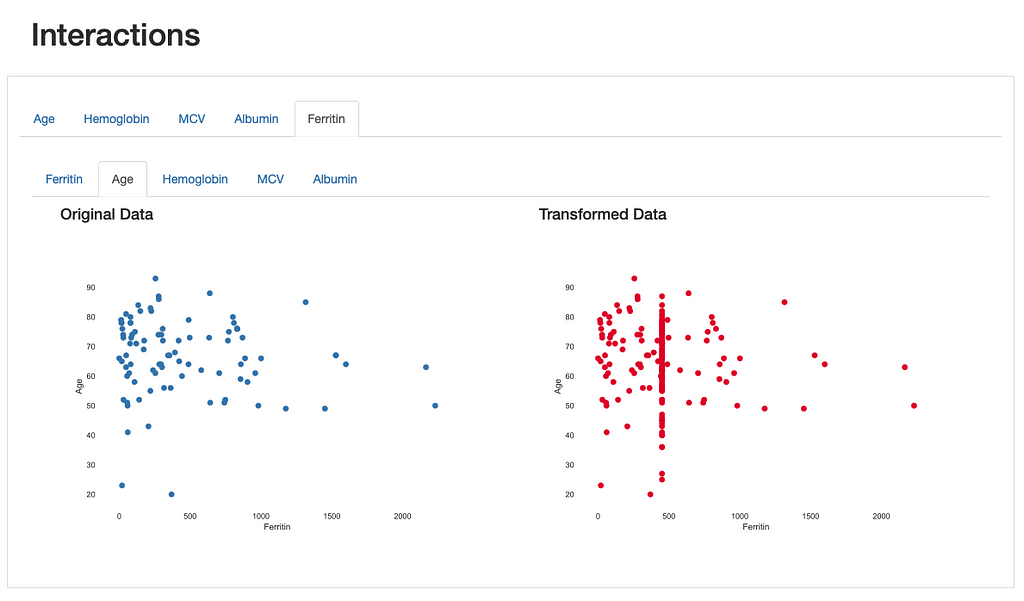
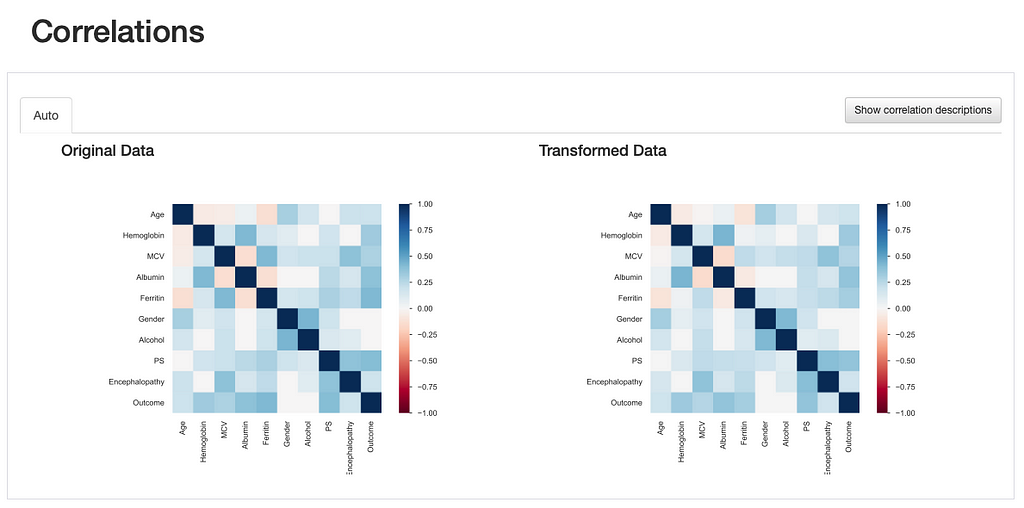
This comes to show that the comparison report is not only useful for highlighting the differences introduced after data transformations, but it provides several visual cues that lead us towards important insights regarding those transformations: in this case, a more specialized data imputation strategy should be considered.
Final Thoughts
Throughout this small use case, we’ve covered the usefulness of comparing two sets of data within the same profiling report to highlight the data transformations performed during EDA and evaluate their impact on data quality.
Nevertheless, the applications of this functionality are endless, as the need to (re)iterate on feature assessment and visual inspection is vital for data-centric solutions. From comparing train, validation, and test sets distributions or data quality control to more advanced use cases such as for the process of synthetic data generation.
Fabiana Clemente, CDO at YData
Accelerating AI with improved data.
How To Compare 2 Datasets With Pandas-profiling was originally published in Towards AI on Medium, where people are continuing the conversation by highlighting and responding to this story.
Join thousands of data leaders on the AI newsletter. It’s free, we don’t spam, and we never share your email address. Keep up to date with the latest work in AI. From research to projects and ideas. If you are building an AI startup, an AI-related product, or a service, we invite you to consider becoming a sponsor.
Published via Towards AI
Towards AI Academy
We Build Enterprise-Grade AI. We'll Teach You to Master It Too.
15 engineers. 100,000+ students. Towards AI Academy teaches what actually survives production.
Start free — no commitment:
→ 6-Day Agentic AI Engineering Email Guide — one practical lesson per day
→ Agents Architecture Cheatsheet — 3 years of architecture decisions in 6 pages
Our courses:
→ AI Engineering Certification — 90+ lessons from project selection to deployed product. The most comprehensive practical LLM course out there.
→ Agent Engineering Course — Hands on with production agent architectures, memory, routing, and eval frameworks — built from real enterprise engagements.
→ AI for Work — Understand, evaluate, and apply AI for complex work tasks.
Note: Article content contains the views of the contributing authors and not Towards AI.
Related posts
Recent Posts


")

