How To Approximate the Results of Your Sample Set (Empirical Rule vs. Chebyshev’s Formula)
Last Updated on May 11, 2022 by Editorial Team
Author(s): Ibrahim Israfilov
Originally published on Towards AI the World’s Leading AI and Technology News and Media Company. If you are building an AI-related product or service, we invite you to consider becoming an AI sponsor. At Towards AI, we help scale AI and technology startups. Let us help you unleash your technology to the masses.
The empirical rule is a powerful instrument to capture the distribution of your observations within the dataset. However, it’s not the only way to do it, particularly when your dataset is not normally distributed.
Index:
1. Problem Description
2. Review Statistics
3. Empirical Rule
4. Chebyshev Theorem
Problem Description
Imagine that you have 60 students in math class and you have monitored the timing of how much it takes students to finish an exercise.
You get the next results. Average : 7', Variance: 5'
We would love to know what is the maximum number of students who spent more than 15' for an exercise.
Review Statistics
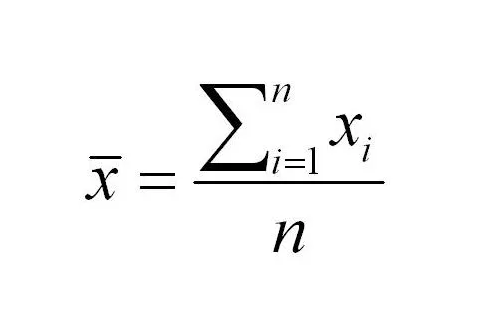
Before going to the solution let’s do a quick recap of the basic statistical notions. The average is calculated following the next formula.

Average takes the sum of all the observations in the dataset and divides by the number of the observations

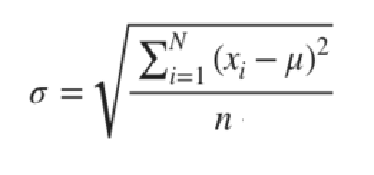
The variance shows the dispersion of the observations around the mean. It takes the sum of the single observation and the mean’s (average’s) difference elevated to the square and divides it by the number of the observations.

For the next step, we will need a standard deviation. Which is simply a square root of the variance.
Empirical Rule
If we have a normally distributed dataset we can apply the empirical rule (sometimes called also 3 sigma rule, because of the Greek sigma sign which defines the standard deviation) to know the probability of the occurrence of the observations to lie within a certain range of the dataset.
Empirical Rule Says:
68% of the observations lie within 1 standard deviation range from the mean.
95% of the observations lie within a 2 standard deviation range from the mean.
99.7% of the observations lie within a 3 standard deviation range from the mean.
Since our problem doesn’t explicitly says us the distribution is normal. We cannot be confident with the empirical rule. In this case, we can use the probability theorem of the Chebyshev.

Chebyshev Theorem
If the dataset is not normally distributed it doesn’t mean that we cannot have an approximation of the distribution of the observations within the dataset.
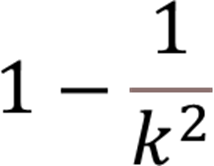
The Chebyshev Formula states:

Where k denotes how many standard deviations we have the distance between the ranges of the interest.
In our case. The standard deviation is going to be 2.24 (Square root of 5)
The equation to find how many standard equations are needed to capture the area before 15' is
15=7+k(2.24)
k(2.24)=8
k=3.57
3.57 standard deviations from the mean are needed to arrive at 15'. Now we have all inputs to calculate the percentage in the range between +- 3.57 from the mean.
1– 1/3.5⁷² = 0.92 * 100
and in order to find the maximum number of the students going beyond 15' is 0.07*60. = ~4 students.
Conclusion
Thank you for your attention. Hope you have enjoyed this article. For any queries or critics feel free to leave a comment.
How To Approximate the Results of Your Sample Set (Empirical Rule vs. Chebyshev’s Formula) was originally published in Towards AI on Medium, where people are continuing the conversation by highlighting and responding to this story.
Join thousands of data leaders on the AI newsletter. It’s free, we don’t spam, and we never share your email address. Keep up to date with the latest work in AI. From research to projects and ideas. If you are building an AI startup, an AI-related product, or a service, we invite you to consider becoming a sponsor.
Published via Towards AI
Take our 90+ lesson From Beginner to Advanced LLM Developer Certification: From choosing a project to deploying a working product this is the most comprehensive and practical LLM course out there!
Towards AI has published Building LLMs for Production—our 470+ page guide to mastering LLMs with practical projects and expert insights!

Discover Your Dream AI Career at Towards AI Jobs
Towards AI has built a jobs board tailored specifically to Machine Learning and Data Science Jobs and Skills. Our software searches for live AI jobs each hour, labels and categorises them and makes them easily searchable. Explore over 40,000 live jobs today with Towards AI Jobs!
Note: Content contains the views of the contributing authors and not Towards AI.


Comments are closed.