


How Data Analytics helped a local Tea Store to increase its Sales by 35% during pandemic?
Last Updated on September 14, 2021 by Editorial Team
Author(s): Supriya Ghosh
Data Analytics
How Data Analytics helped a local Tea Store to increase its sales by 35% during a pandemic?
Each one of us is familiar with the havoc of COVID-19 and how it led to a massive downturn of businesses in 2020. Business sales dropped unprecedentedly due to the pandemic globally. The widespread closing of stores and businesses in and around the world happened in the pandemic because of many factors — viz. by policy mandate, downward demand shifts, health concerns, and many other factors.
The relative revenue losses among small businesses during the onset of the COVID-19 crisis were much larger than among big businesses. Small businesses had a lower ability to quickly adjust to changes in regulations and demand when the pandemic hit.
But there was this local tea store which made 35% more Sales than the previous year during this time.

How did this happen?
What insights could the manager of the store derive from his data analysis?
What strategy was employed to increase revenue?
It is all worthwhile to catch a glimpse of it.

For this, let me start with the Store’s 2019 Sales figures.
Disclaimer: Exact data and figures of the store cannot be revealed hence considered made-up data to show the strategy employed.
Assumptions — The Sold Units for the FY2019 and FY2020 for the same packaging and the same Unit price remain constant (i.e., inelastic demand for tea is being observed).
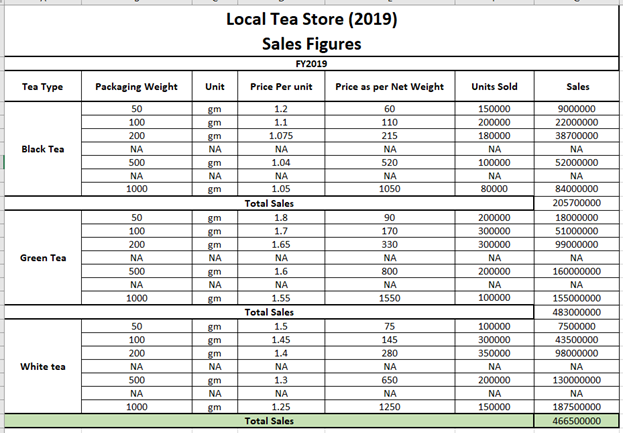
The above table depicts the packaging weight considered for FY2019 Sales is
50 gm,
100 gm,
200 gm,
500 gm and
1000 gm
which contributes to total annual sales of 466500000 (specific currency not mentioned to make the calculation independent of any unit.)
Similarly, let me represent the Store’s 2020 Sales figures.
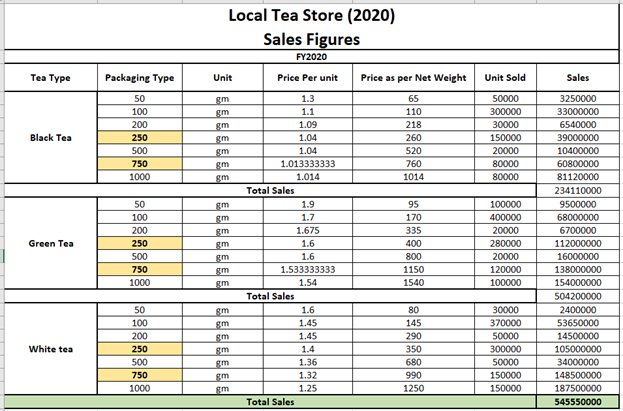
The above table depicts the packaging weight considered for FY2020 Sales is
50 gm,
100 gm,
200 gm,
250 gm,
500 gm
750 gm and
1000 gm
which contributes to total annual sales of 545550000 (specific currency not mentioned to make the calculation independent of any unit.)
Does this mean, introducing the new Packaging weight of 250 gm and 750 gm did the magic and the Sales increased from 466500000 to 545550000?
Well, it can be said as “Yes” and “No” both. But how let me explain you in detail.
For understanding this, let me represent the data which represents FY2019 and FY2020 Sales figure together along with % change in Sales observed in Current year from the previous year.
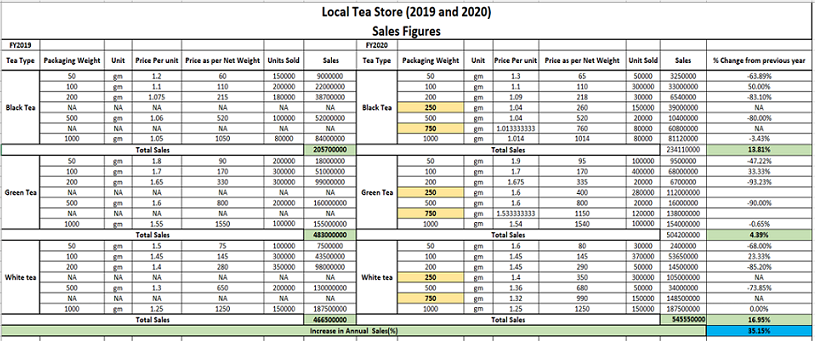
The above data shows :
The new packaging weight of 250 gm and 750 gm introduced has a unit prices (1.04 and 1.013, 1.6 and 1.533 and 1.4 and 1.32) less than the other comparable packaging weights, respectively.
In fact, if you carefully observe the unit price of the earlier packaging of 50 gm, 200 gm has been increased in all of the cases in FY2020 compared to FY2019 and 1000 gm has been either reduced or held constant in all the cases in FY2020 compared to FY2019 but the unit price for new packaging weight of 250 gm and 750 gm has been kept comparatively less.
How does this affect Sales? Let us try to understand.
I already mentioned that the Units sold annually for specific packaging weight are constant till the unit price is not varied as this is a local store with a specific area and Customer base to cater to.
On similar lines, what happens is, the new packaging, when introduced has a lesser unit price than its earlier packaging weights which shifts the customer base towards new packaging weights (i.e., 250 gm and 750 gm) from the comparable old ones.
For e.g. — If you observe “Table 3”, you will see that for “Black Tea, introducing 250 gm packaging at a unit price of 1.04 which is lower than 1.09 (packaging weight of 200 gm), shifts the customer base towards 250 gm packaging as the unit price is less and it observes 1,50000 Customer Base shift from earlier 1,80,000 of 200 gm packaging. In turn, the FY2020 observes, only 30,000 customer bases for 200 gm packaging than 1,80,000 earlier.
Most of its customer base (1,50,000) shifts towards 250 gm packaging due to reduced unit price. This marks a big difference in Sales.
Similarly, you can observe data for other packaging weights, and you will find out that the same phenomenon is repeating in the case of 750 gm packaging as well.
This leads to quite a good amount of increase in Sales (35.15% overall).
What is this strategy employed by this Tea Store called?

It is called a “Targeted Segment Sales Maximization Pricing Strategy”.
Let me explain in detail the “Targeted Segment Sales Maximization Pricing Strategy”.
Tea store observed a fairly inelastic demand curve for Tea hence it took advantage of this with a small price increase for the existing packaging and a small price decrease for its new packaging which made a huge positive impact on their Sales without decreasing demand for it it beverage. It targeted the price-sensitive customer base and earned the differentiated worth of its different packaging ranges.
This is the strategy that can be employed by any organization having an inelastic demand curve after careful analysis of their data and evaluating the trends.
Hope you all enjoyed reading this write-up.
Keep reading as it motivates me to bring more and more.
You can follow me on medium as well as
LinkedIn: Supriya Ghosh
And Twitter: @isupriyaghosh
How Data Analytics helped a local Tea Store to increase its Sales by 35% during pandemic? was originally published in Towards AI on Medium, where people are continuing the conversation by highlighting and responding to this story.
Published via Towards AI
Towards AI Academy
We Build Enterprise-Grade AI. We'll Teach You to Master It Too.
15 engineers. 100,000+ students. Towards AI Academy teaches what actually survives production.
Start free — no commitment:
→ 6-Day Agentic AI Engineering Email Guide — one practical lesson per day
→ Agents Architecture Cheatsheet — 3 years of architecture decisions in 6 pages
Our courses:
→ AI Engineering Certification — 90+ lessons from project selection to deployed product. The most comprehensive practical LLM course out there.
→ Agent Engineering Course — Hands on with production agent architectures, memory, routing, and eval frameworks — built from real enterprise engagements.
→ AI for Work — Understand, evaluate, and apply AI for complex work tasks.
Note: Article content contains the views of the contributing authors and not Towards AI.
Related posts
Recent Posts


