Hotel Data Visualization With Python
Last Updated on July 26, 2023 by Editorial Team
Author(s): Oluwatimilehin Ogidan
Originally published on Towards AI.
Hotel or resort?
Intro
Have you been curious to find out whether people loved to visit hotels or resorts more? or what sort of meals do people prefer most in hotels? If you are curious just like me, don’t worry, these are some of the interesting discoveries and many more we are going to be uncovering in the visualization and analysis of the hotel data
For someone given to traveling and vacations, visualizing the Hotel booking demand data was an exciting one for me. I was able to discover amazing things about hotels and the behavior patterns of people who visit them and I will love to share those amazing discoveries with you in this article and am sure you gonna love them.
So sit tight as we explore the hotel’s data
Data Source
This data was sourced from Kaggle’s data repository. Kaggle is a public online repository of data that allows users to access and analyze data from taken from different sources. The hotel data shows quite a number of features that shows different characteristics of different people who visit the hotels. Some of the characteristics include arrival day, lead time, deposit type, and a lot more features. You can find the data here on Kaggle.
Data Wrangling and Visualization
The python programming language is a cool language in the sense that it has a lot of cool libraries that make data cleaning, sorting, visualization, and processing easy. The most popular of them is the panda's library which is built on top of the NumPy library. It manages different tasks in data analysis from loading the data, to cleaning and processing it to even visualizing the data. The popular Matplotlib library is another library that was also built on the panda's library to make visualization very easy through the different functions it provides. The Seaborn library was also developed to create more attractive and illuminating statistical graphics to give insights into the plots
If you need more information about this library and how they work, you can check out their documentation.
Here is a quick overview of what the data looks like

The codes can be found here on Github.
Let's hop right into a visualization of the different columns
Hotel Type

Observation
We can see that about times two of the total number of people who booked hotels prefer the city hotels to the resort hotels.
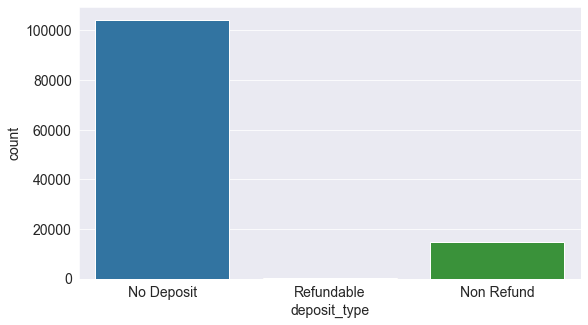
Deposit Type

observation
This shows that quite a high number of people did not make any deposits.
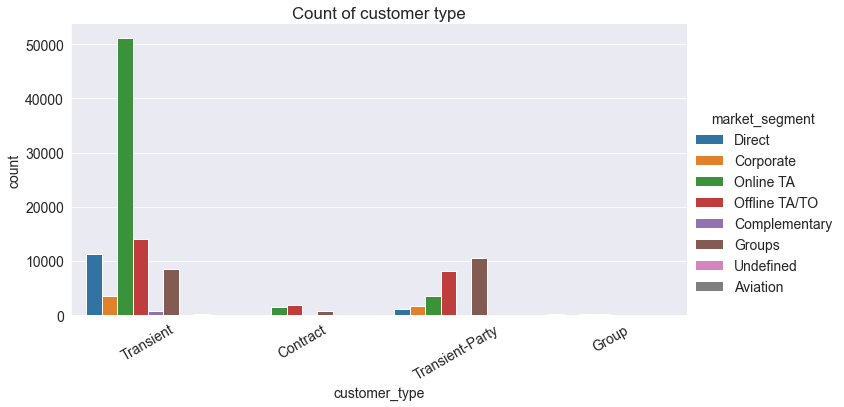
Customer Types in the Market Segments

observation
From the chart, we can see:
- The largest number of people who visit the hotel is the transient customers and a huge number of them come from the online TA market segment next to the offline TA/TO
- A very few people who book at the hotels at contract customers
- A good number of transient-party customers come from the groups market segment next to the offline TA/TO.
Arrival Months

observation
More people arrived at the hotel in the month of August while the least number of people arrived in the month of January
Market Segment

Observation
The market segment that patronizes the hotel most omes from the online TA while the least comes from the aviation
Which day do people arrive most at the hotel?

Observation
On average, most customers arrive on the 15th day of the month.
Which customers cancel bookings most

Observation
Most of the canceled bookings come from the transient customers next to the transient-party customers then the contact customers then the groups.
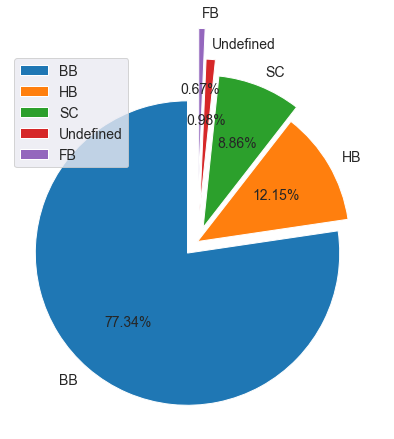
Which meal do customers prefer more

Observation
From here, we can see that a lot of customers prefer breakfast in bed(BB) while just a few prefer FB
Which year is the busiest year

Observation
From the data, 2016 has been the busiest year
Which country do the most frequent visitors come from

Observation
Most frequent visitors of this hotel are from PRT
Which market segment has the highest stay in weekend night

Observation
The online TA had more weekend stays next to the offline TA/TO than to the groups and the rest
What type of meals do the repeated guests enjoy most?

observation
Most of the returning guests also love breakfast in bed
Relationship between lead time and canceled bookings

People who canceled their booking have a higher lead time on average than those who didn’t cancel theirs. A higher variance also exists among those who didn’t cancel their booking.
The codes can be found here.
Modeling
After performing a lot of visualization, I had to use Pandas.getdummies on all the categorical variables for easy modeling. This is a classification task. So, Logistic Regression is the best fit for it (Don’t worry, it isn’t as technical as it sounds). I imported confusion_matrix and f1_score to measure the classification accuracy.
Conclusion
- A lot of people loved to visit the city hotels than the resort hotels
- More people arrived at the hotel in the month of August which makes perfect sense because the month of August falls in the summer break of the northern hemisphere while the lowest falls in the month of January which is quite explainable because January is the beginning of the year and book tend to focus more on work
- Majority of people who book at the hotels come online TA market segment since a lot of people spend most of their time on the internet thereby making it easy for them to book rooms at the hotel
- Most customers prefer Breakfast in Bed(BB). After all, who doesn't like enjoyment?
If you find the article insightful, do well to clap and share. You may also connect with me on LinkedIn and Twitter
Join thousands of data leaders on the AI newsletter. Join over 80,000 subscribers and keep up to date with the latest developments in AI. From research to projects and ideas. If you are building an AI startup, an AI-related product, or a service, we invite you to consider becoming a sponsor.
Published via Towards AI
Take our 90+ lesson From Beginner to Advanced LLM Developer Certification: From choosing a project to deploying a working product this is the most comprehensive and practical LLM course out there!
Towards AI has published Building LLMs for Production—our 470+ page guide to mastering LLMs with practical projects and expert insights!

Discover Your Dream AI Career at Towards AI Jobs
Towards AI has built a jobs board tailored specifically to Machine Learning and Data Science Jobs and Skills. Our software searches for live AI jobs each hour, labels and categorises them and makes them easily searchable. Explore over 40,000 live jobs today with Towards AI Jobs!
Note: Content contains the views of the contributing authors and not Towards AI.


