


Geocode Millions of Locations Without Being Sued
Last Updated on January 6, 2023 by Editorial Team
Author(s): Paul Kinsvater
Originally published on Towards AI the World’s Leading AI and Technology News and Media Company. If you are building an AI-related product or service, we invite you to consider becoming an AI sponsor. At Towards AI, we help scale AI and technology startups. Let us help you unleash your technology to the masses.
With GeoBatchPy and geospatial analytics in mind
Exponential Time Smoothing (ETS) is a technique prevalent in the time series forecasting community that is about down-weighting signals from increasingly distant times. And similar methods are standard in predictive models outside time series forecasting as long as time is part of the problem. Do you want to predict customer churn? Try with a weighted average of past purchase amounts.
The geospatial equivalent of temporal weights is a spatial weight matrix. The same idea applies: compute a weighted average, with weights depending on spatial distance on a two-dimensional coordinate system. But, unlike with time, distance in space requires significant preliminary work. Likely, you start with (structured) address texts as your location records. So, how to bring them on a coordinate system?
Below we will use the longitude-latitude coordinate system. And the transition from texts to longitude-latitude is called geocoding. There are dozens, if not hundreds, of geocoding service providers. But the choice turns out to be risky for costs and legal reasons.
Read the license if you don’t want to be banned or sued
It would be best to be careful when picking a geo service provider. Google Maps and Mapbox are two prominent yet poor choices for our analytics use cases due to their restrictive license — you are not allowed to store and redistribute results. E.g., Google has created mechanisms to detect abuse of their APIs, which, in the best case, results in a ban on your account. So, storing millions of geocodes for later analytics is not allowed.
Fortunately, a startup called Geoapify fills this niche with bravura. It is not just about legal reasons. It is also about costs, comfort to use (batch processing), and good integration into open data and open source standards.
Why Geoapify for geospatial analytics
In short, this is why we chose Geoapify:
- We need to geocode millions of location records without going bust. Geoapify offers batch geocoding at a 50% discount.
- Geoapify uses OpenStreetMap and other open data sources with a friendly license so that we can store results for analytics. As a side effect, we can link our internal location records with a rich ecosystem of open data sources like Wikidata.
- Geoapify is not just about geocoding. It also offers place details, isolines, travel distances, and more — with most services covered by their Batch API at a 50% discount.
Start at zero cost today using Geoapify’s services, including commercial use. Their free tier allows batch geocoding of 6k addresses per day. Sign up at geoapify.com and generate your API key in no time.
Tutorial — GeoBatchPy for batch geocoding and more
We love Python and the command line. When we started, no Geoapify API client fulfilled our needs. So, we created GeoBatchPy.
GeoBatchPy is a Python client for the Geoapify API. And it comes with a command line interface for their Batch API, which shines when you need to process large numbers of locations. You can install the latest release from PyPI with pip install geobatchpy. But we recommend creating a new Conda environment covering GeoPandas and PySAL if you want to follow along with the tutorial below using your data.
This tutorial shows how to integrate GeoBatchPy into a geospatial analytics workflow, starting from simple address records, followed by batch geocoding, to computing spatial weight matrices. We conclude with a simple analytics use case.
Part 1 — data preprocessing
Our dataset for this tutorial consists of 1081 sports stadiums, mainly across Germany, Belgium, Netherlands. We generated the data using Geoapify’s Places API.
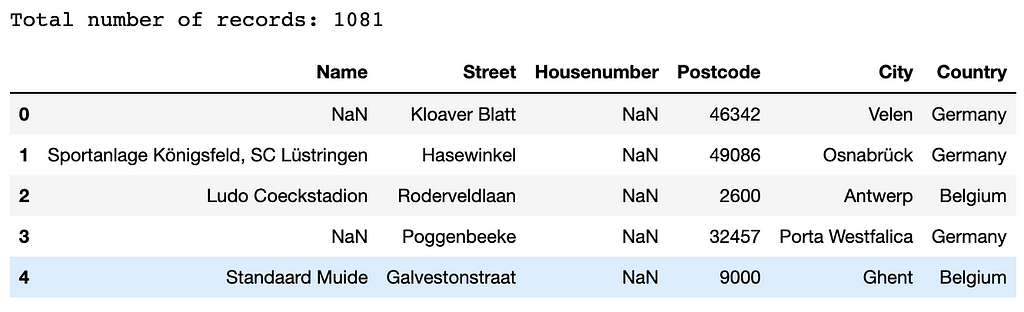
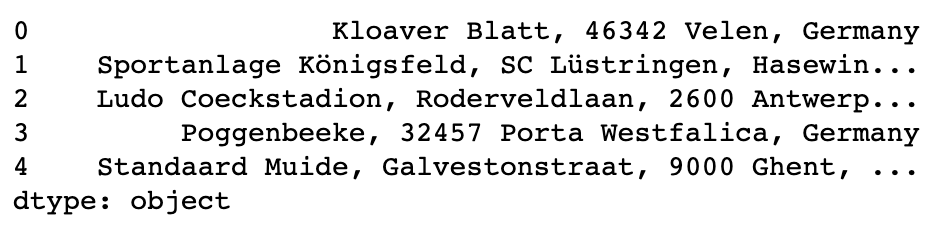
Geoapify’s geocoding service accepts free text search and structured input, the latter being helpful only if we have a lot of faith in our data quality. I have seen too many data quality issues in real-world structured address records. And my conclusion is to go for the free text search. Here, we parse the structured data into one string per row.
Part 2 — geocoding
It is time to geocode our addresses. You can do this using our Python API, but we prefer the command line. First, we prepare the input file using Python:
Now we switch to the CLI. To make the following two commands work, you need to either set your GEOAPIFY_KEYenvironment variable or add option –api-key <your-key> to the end of every geobatch command. First, we submit jobs to Geoapify servers with
The output of the first step, tutorial-geocode-urls.json is the input for the next:
Processing our requests takes time, depending on the request size, the subscription plan, and how busy Geoapify servers are.
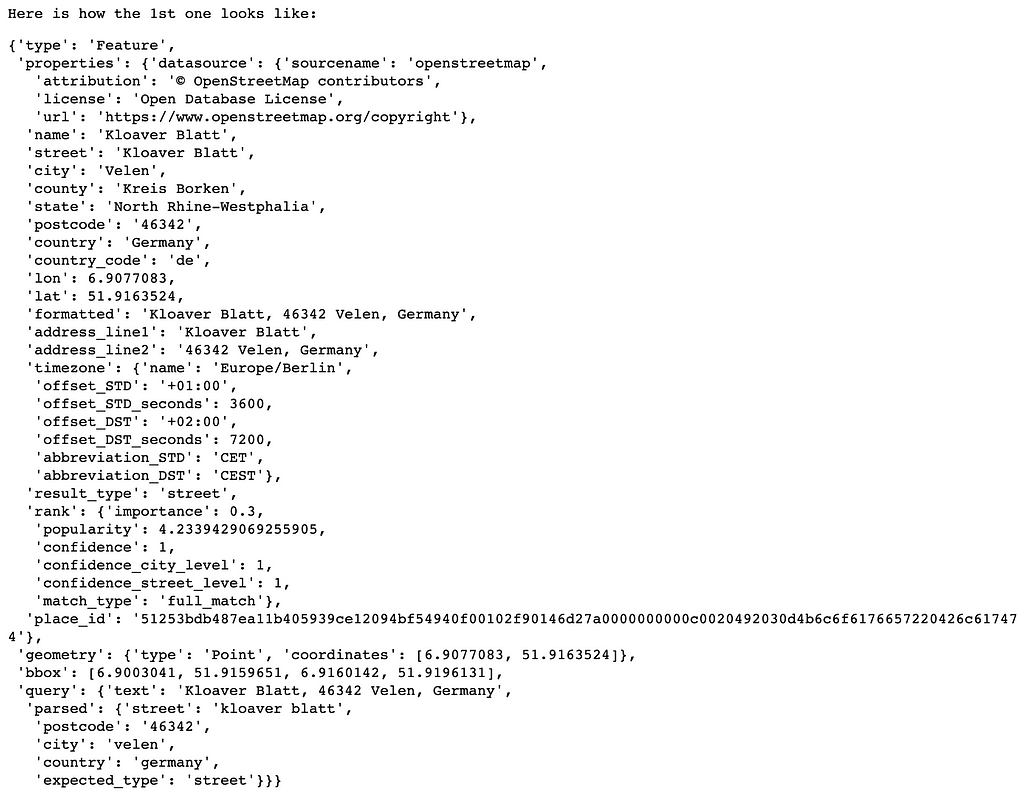
We convert the results into a simplified list of GeoJSON-like Python dictionaries.
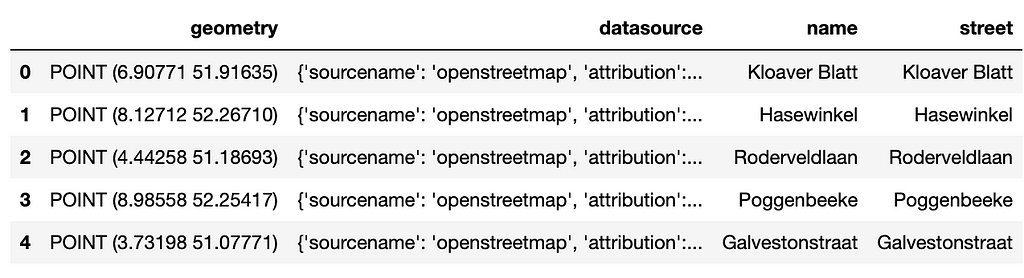
GeoPandas helps us transform the data into a tabular format. The method parses the geometry into a Shapely geometric object, puts all properties into separate columns, and ignores the rest. We also set the coordinate reference system (CRS) to 'EPSG:4326', meaning that the geometries' tuples are interpreted as longitude and latitude.
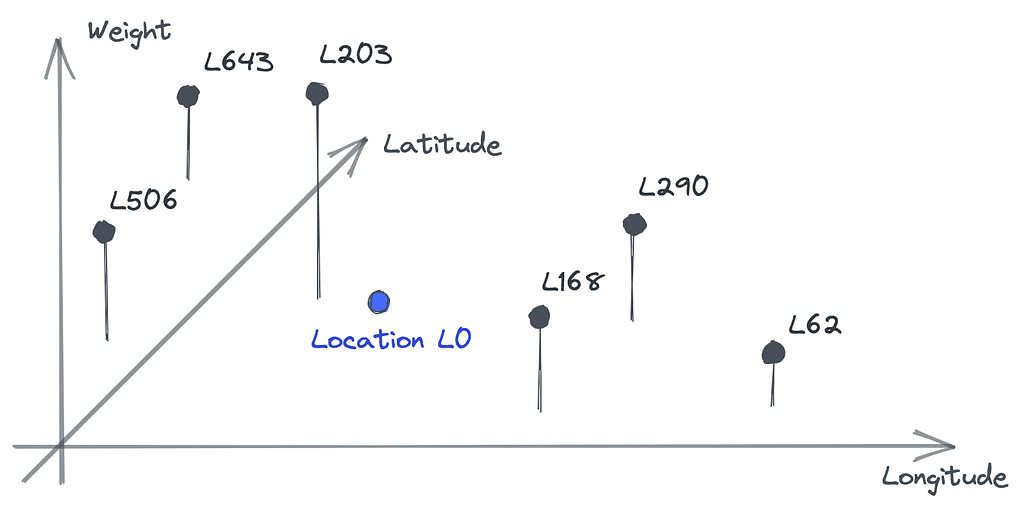
Part 3 — spatial weight matrices
We are going to use PySAL and its distance-based approach to compute a spatial weight matrix — PySAL comes with several methods, each with its own requirements. The distance-based method accepts our data frame of geocodes as input and computes weights which, by default, decay linearly with increasing distance.
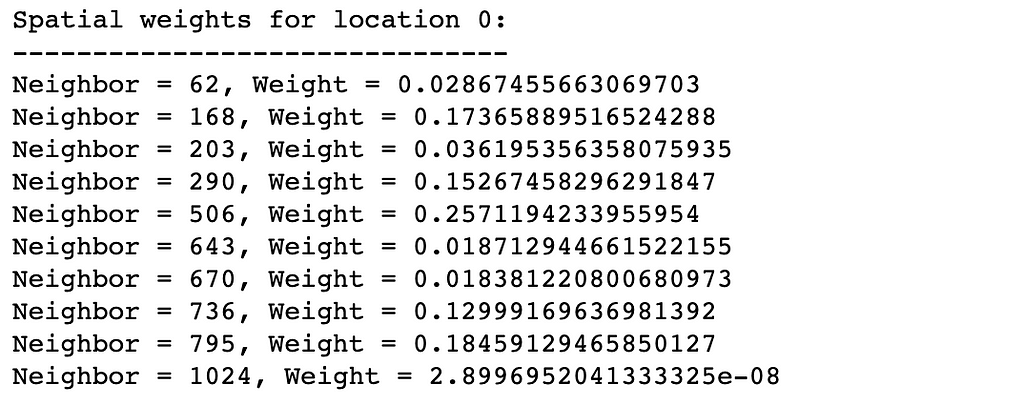
We apply three changes to the default behavior:
- Parameters fixed=False and k=10 result in variable strength of decay per target location. This way the number of non-zero weights is k=10 in every location’s neighborhood.
- We set weights on the diagonal to 0. That excludes every target location from its set of neighbors with non-zero weights. This will be relevant to our use case.
- Setting attribute transform='R' normalizes weights for any given target location so that their sum equals 1.
Part 4 — a simple analytics use case
Say we want to predict a location’s property price per square meter from available prices in its neighborhood. We compute a weighted average reusing our spatial weight matrix from the previous section:
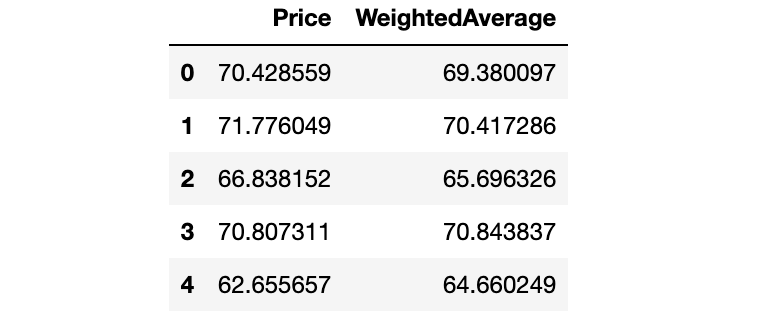
The next plot indicates that the weighted average alone is an unbiased predictor of the price.
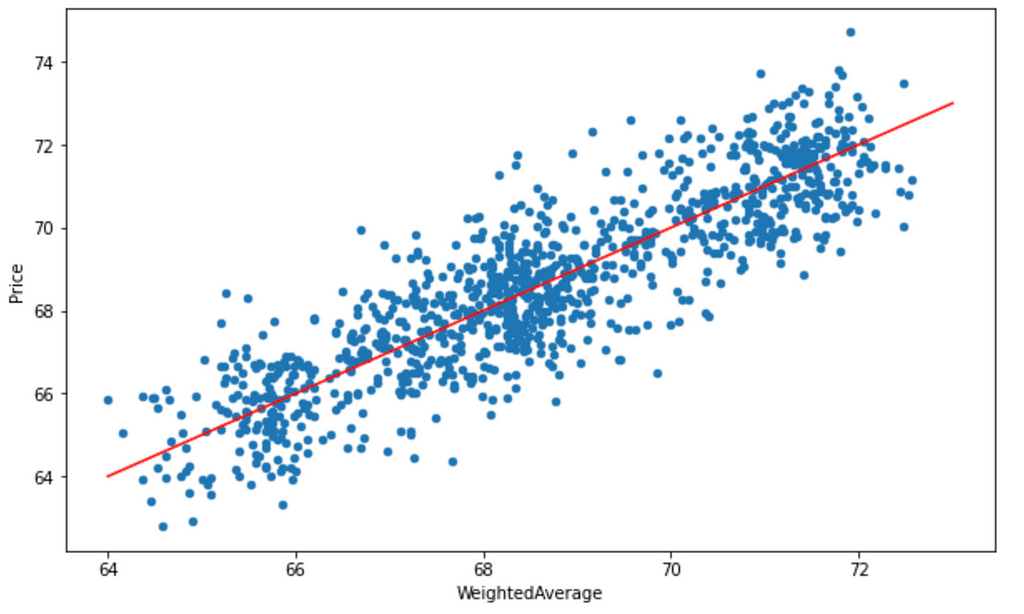
Now it becomes obvious why we set the diagonal weights to 0, excluding the target from its neighborhood weights. This way, we can predict the price of any new location with the weighted average of its neighbors with known prices.
In a more realistic scenario, you would want to consider more than neighboring prices in your prediction model to reflect significant variations in closeby locations. E.g., two neighboring locations can be priced very differently if one is directly exposed to a lot of noise from traffic. The weighted average can then be used as one of many predictors in a regression model fitted to our data.
Conclusion and outlook
Most (or all?) businesses process address data for day-by-day operational purposes. For invoicing, delivery of goods, customer visits, etc. Internal location data amount to thousands, if not hundreds of thousands, location records very quickly. Utilizing that same data for geospatial analytics usually relies on significant preparation work, like geocoding. We show how to avoid unnecessary expenses and legal risks using Geoapify and our Python package — with just a few lines of code. Practically every analytics project has the potential to benefit from a geospatial dimension.
We motivate spatial weights by starting with the temporal equivalent, which finds wide adaption in the analytics space. It is not just about one or the other. Models can combine time and space to account for both—first, down-weight individual signals from a temporal distance. Second, spatially combine those temporarily down-weighted signals. E.g., when we study customer churn, we can compute average loyalty in every customer’s neighborhood. We identify the date and location of every churner from the past— that’s the (binary) signals. And we compute weighted averages taking into account the number of active customers for every current customer’s neighborhood, weighted by distance in time and space. E.g., this indicates if a customer lives in an area of recently increased local competition — something we would want to act on quickly.
Geocode Millions of Locations Without Being Sued was originally published in Towards AI on Medium, where people are continuing the conversation by highlighting and responding to this story.
Join thousands of data leaders on the AI newsletter. It’s free, we don’t spam, and we never share your email address. Keep up to date with the latest work in AI. From research to projects and ideas. If you are building an AI startup, an AI-related product, or a service, we invite you to consider becoming a sponsor.
Published via Towards AI
Towards AI Academy
We Build Enterprise-Grade AI. We'll Teach You to Master It Too.
15 engineers. 100,000+ students. Towards AI Academy teaches what actually survives production.
Start free — no commitment:
→ 6-Day Agentic AI Engineering Email Guide — one practical lesson per day
→ Agents Architecture Cheatsheet — 3 years of architecture decisions in 6 pages
Our courses:
→ AI Engineering Certification — 90+ lessons from project selection to deployed product. The most comprehensive practical LLM course out there.
→ Agent Engineering Course — Hands on with production agent architectures, memory, routing, and eval frameworks — built from real enterprise engagements.
→ AI for Work — Understand, evaluate, and apply AI for complex work tasks.
Note: Article content contains the views of the contributing authors and not Towards AI.
Related posts
Recent Posts


")

