


Data Preprocessing in R Markdown
Last Updated on January 28, 2023 by Editorial Team
Last Updated on January 28, 2023 by Editorial Team
Author(s): Mohammed Fayiz Parappan
Originally published on Towards AI.
for Machine Learning
Data preprocessing constitutes cleaning, sampling, analyzing, transforming, and encoding data so that it can be easily interpretable to provide insights or can be fed into a machine learning model.
Data is the new oil. It is crucial to have data in an interpretable form.
In this article, I will discuss the implementation of Data Preprocessing methods in R. I will be using Heart Attack Analysis and Prediction Dataset provided by Kaggle.
Steps in Data Preprocessing
- Import the designated data file and Explore
- Handle Missing Values, Remove duplicates and irrelevant observations
- Fix structural errors
- Filter unwanted outliers
- Measures of central tendency (calculate mean, median, mode, and frequencies)
- Measures of dispersion (calculate variance, standard deviation, range, inter-quartile range, coefficient of variance)
- Calculate the correlation coefficient and correlation plot
- Check the distribution of features using histograms and a Normal Probability Plot
- Data Splitting
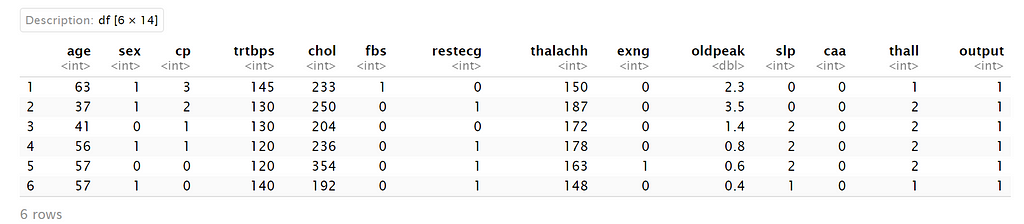
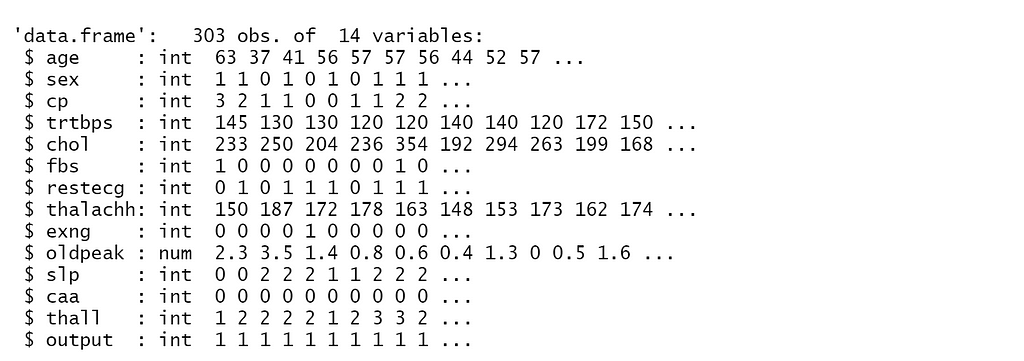
- Import the designated data file and Explore
You can find more details on the dataset here: https://www.kaggle.com/datasets/rashikrahmanpritom/heart-attack-analysis-prediction-dataset/
Unlike many other programming languages, datasets in the form of CSV and TXT files can be directly imported without any library in R.
2. Handle Missing Values, Remove duplicates and irrelevant observations
In R, missing values are represented by NA (not available).
As no missing values are there, no missing value techniques are used. In case missing values are found, either they are removed or replaced by mean or approximations.
Duplicate data can contaminate the interpretability of the dataset and may also lead machine learning models to learn patterns that do not exist in reality.
The index of the only duplicate row is found and removed from the dataset.
3. Fix structural errors
As missing values and duplicates are now removed, let’s check if the distribution of dataset w.r.t output is balanced or not. The dataset is labeled as 0’s and 1's.
- 0 = No Heart Attack Occurs
- 1 = Heart Attack Occur
As there are a similar number of observations of both classes, the dataset is balanced enough.
4. Filter unwanted outliers
Outliers are extreme data points that do not match with general trends seen in other points of the dataset. It can have a crucial impact on the interpretations and results given by ML models. It is important to note that the mere appearance of outliers doesn’t mean they should be removed. Only those outliers which are irrelevant for data analysis should be removed.
Outlier data points in a dataset can be detected with the help of Cook’s Distance which is a metric to measure the influence of each data point over the model (here, linear regression is shown) into which the dataset is fed. Cook’s distances can be easily calculated in R using olsrr library that can be installed from Tools -> Install Packages.

Note that conditions for treating data points as outliers are subjective. Here, I have treated data points whose Cook’s distances are more than five times the mean Cook’s distance as outliers. There are 9 such points, and they were filtered from the dataset.
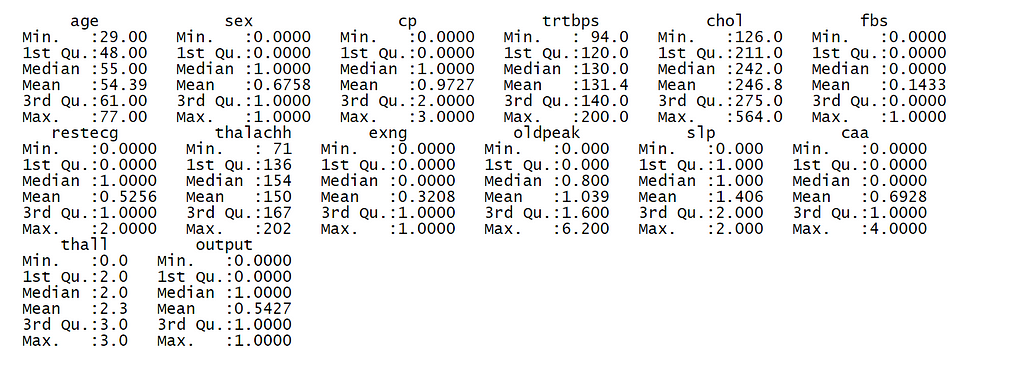
5. Measures of central tendency (mean, median, mode, and frequencies)
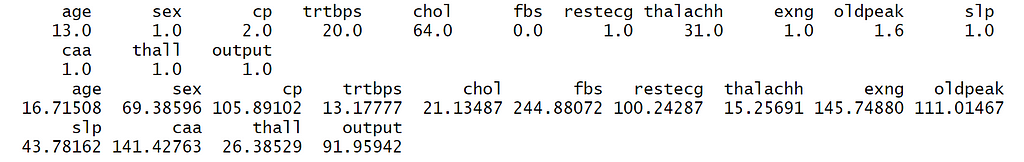
The mean, median, mode, minimum, maximum, and quartiles of each dataframe in the dataset can be extracted from the summary of the dataset.
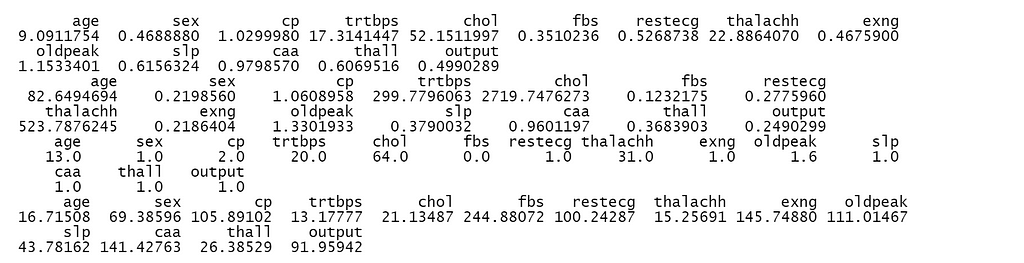
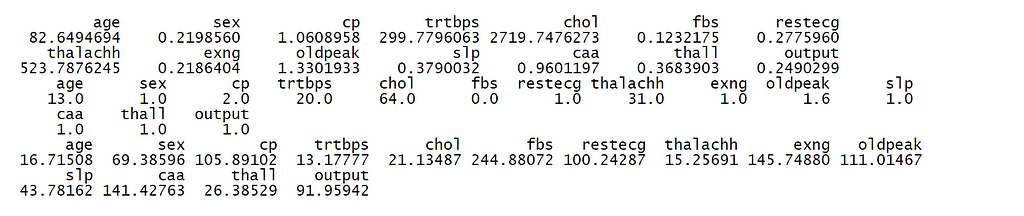
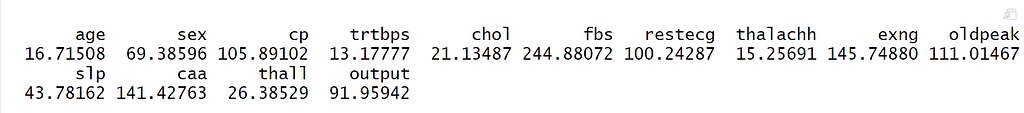
6. Measures of dispersion (variance, standard deviation, range, inter-quartile range, coefficient of variance)
I have used sapply() function, which takes a list or vector or data frame as input and gives output as a vector or matrix to get the values of measures of dispersion.
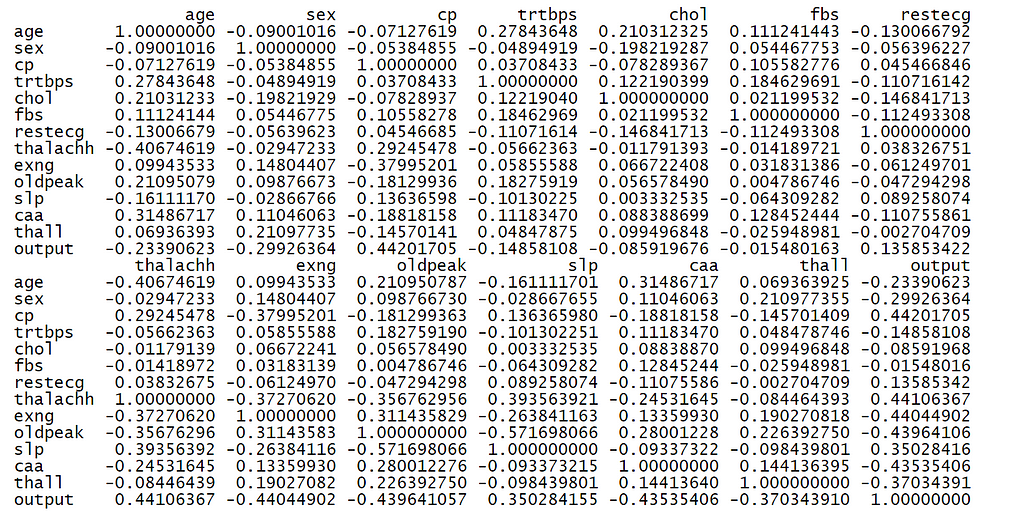
7. Calculate the correlation coefficient and correlation plot
A correlation coefficient is a number between -1 and 1 that tells the strength (along with direction) between features of the dataset. It is useful to detect multicollinearity, which kills independence between features of the dataset and can lead to inaccurate parameter estimates by ML models.
A correlation plot helps in visualizing correlation coefficients between features of the dataset. It is plotted in R using corrplot library, which can be installed from Tools -> Install Packages.
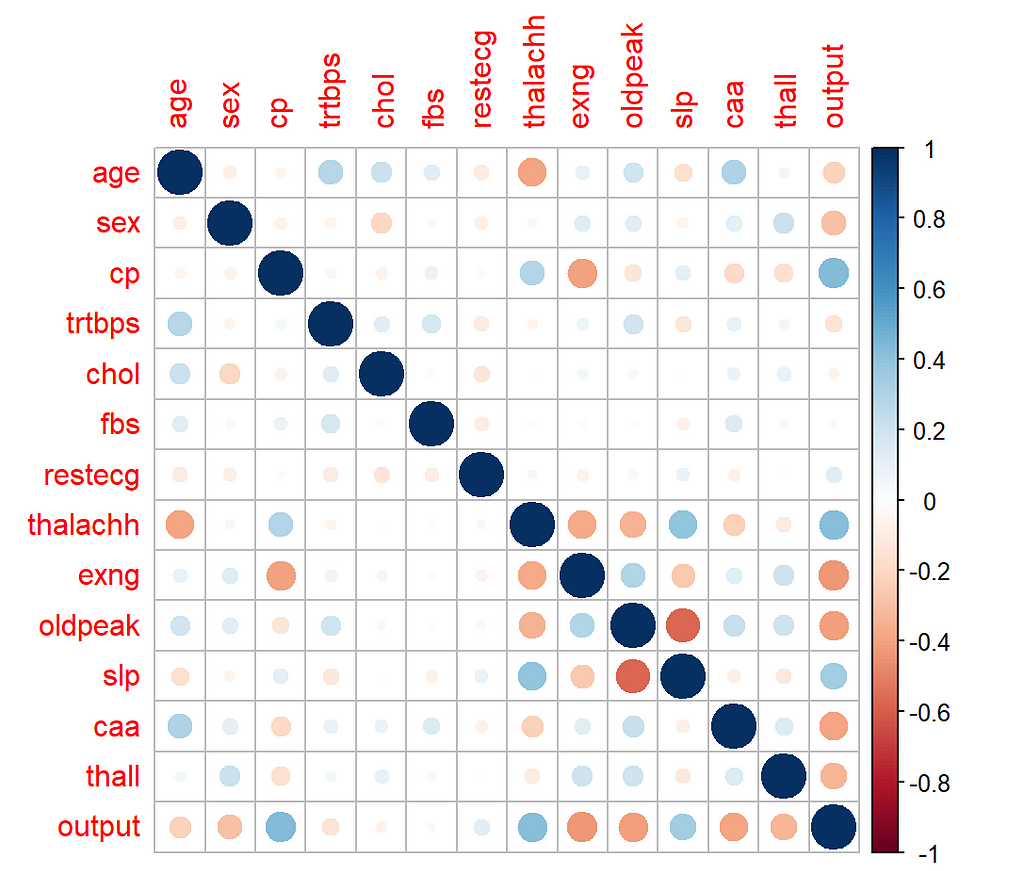
Notice that intensity of the blue color shows the strength of positive collinearity, while the intensity of the red color shows the strength of negative collinearity.
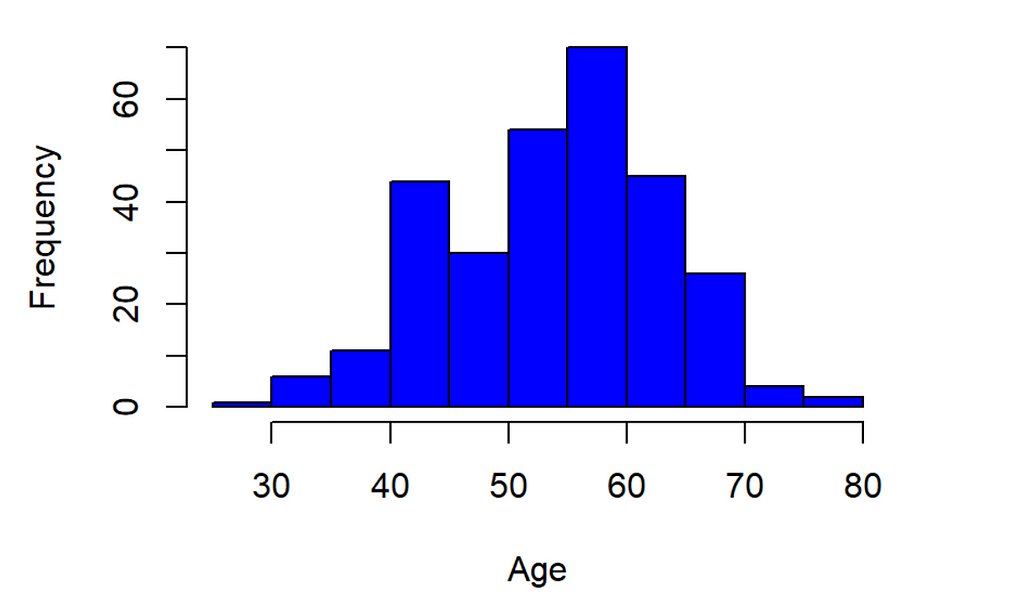
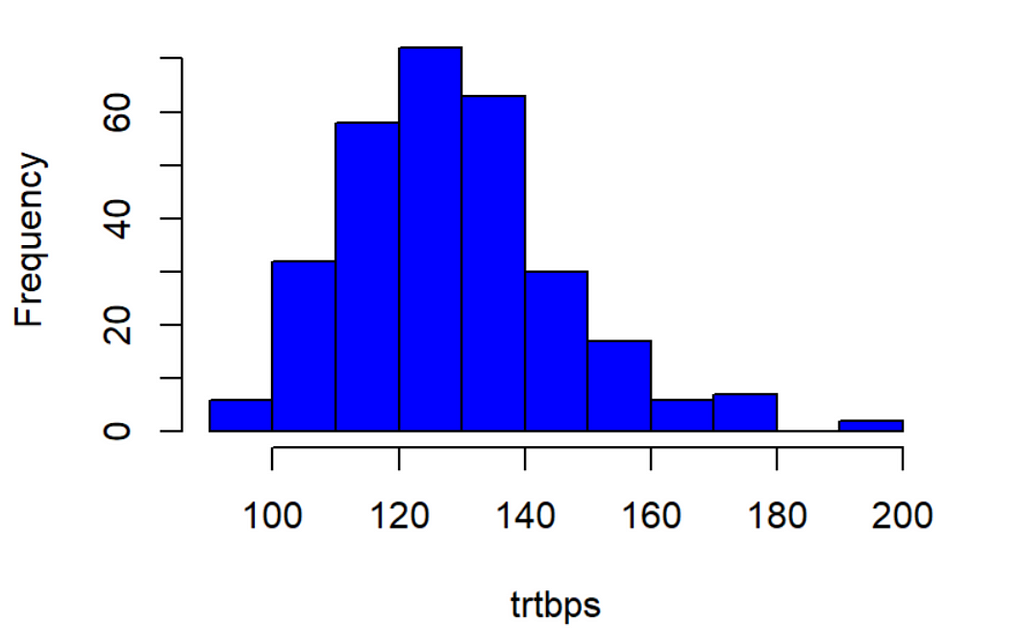
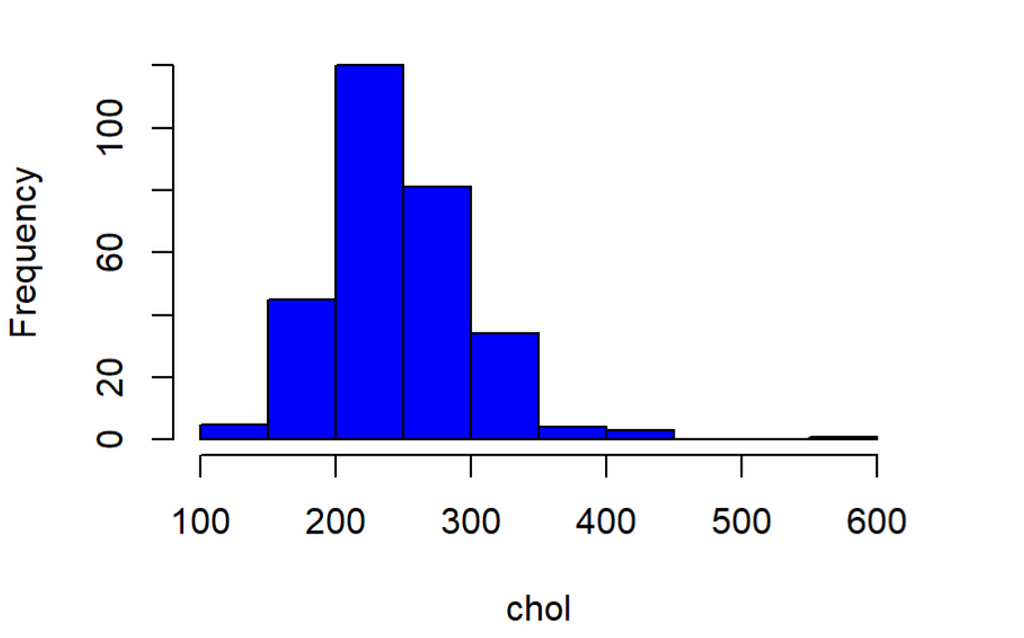
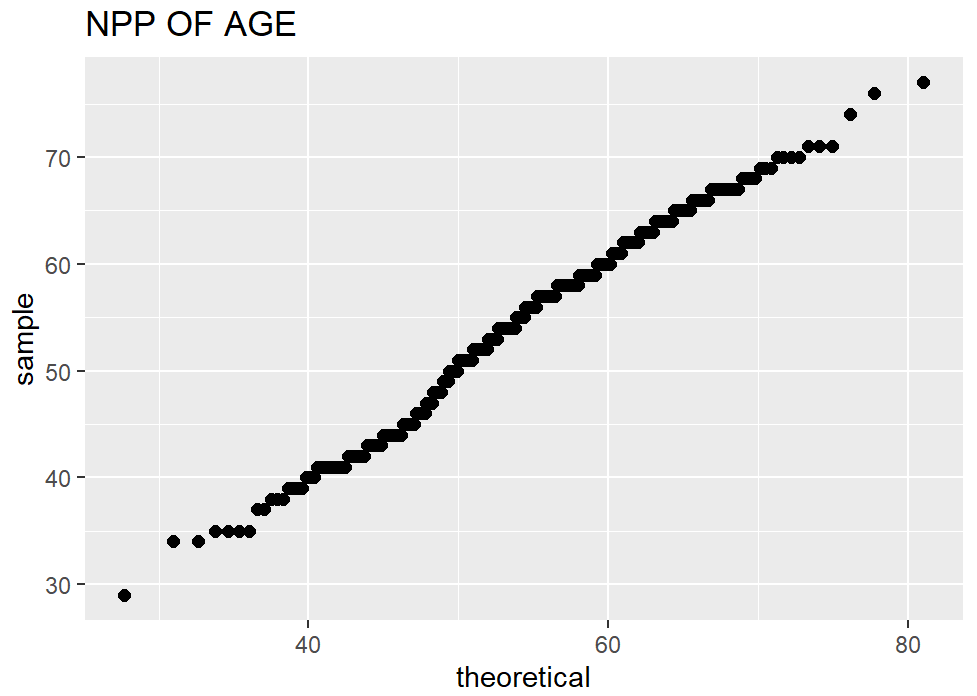
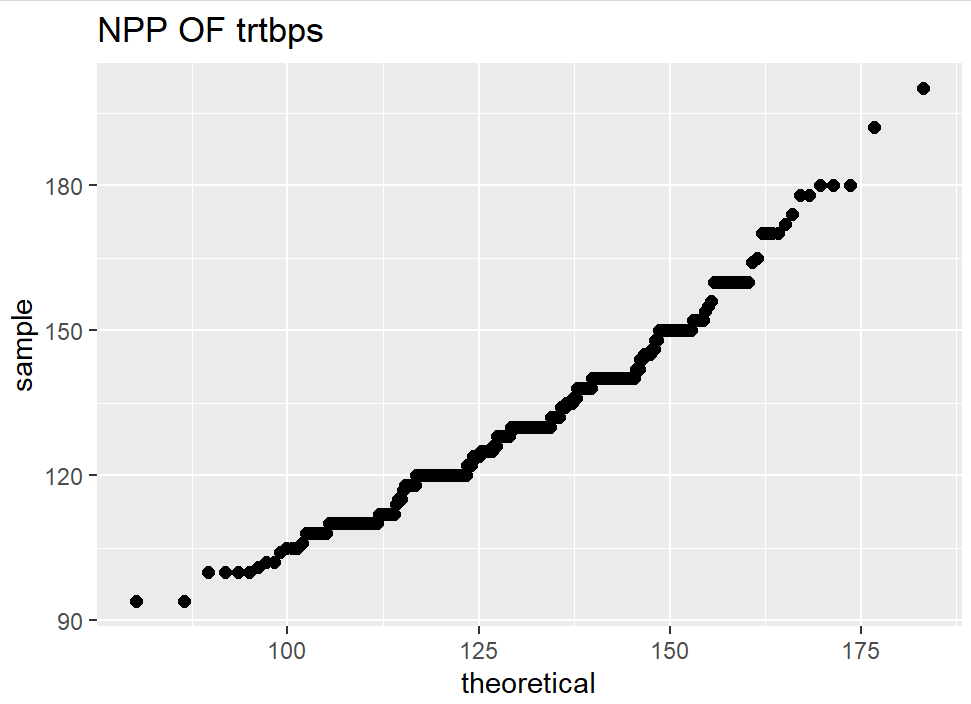
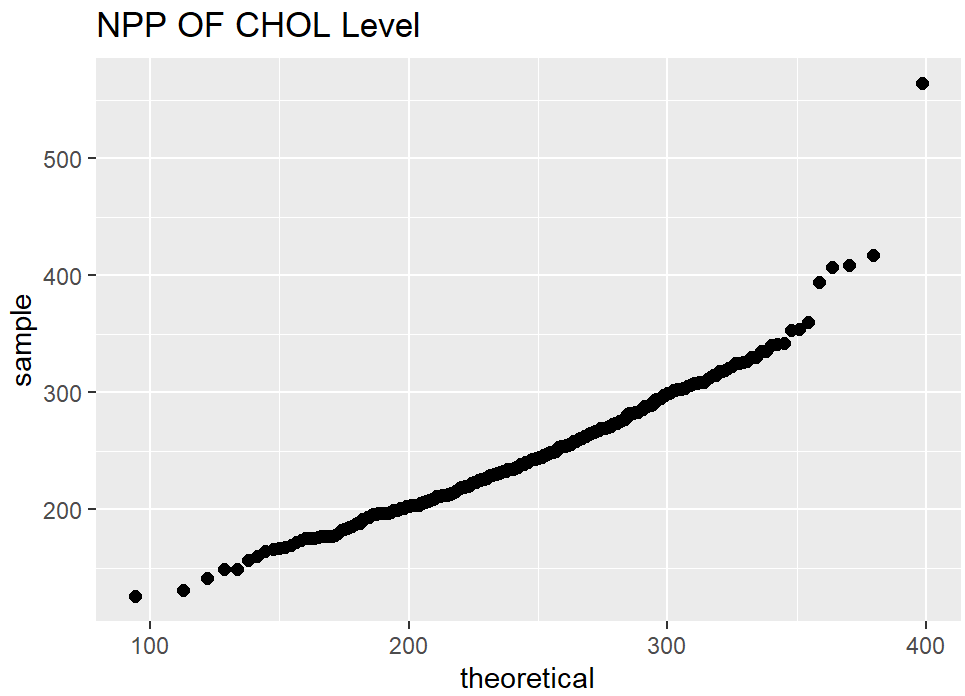
8. Check the distribution of features using Histograms and Normal Probability Plot
Histograms show how the values of each feature are distributed, which can give interesting insights into the dataset. A normal probability plot tells us how close the feature distribution is to the normal distribution. I used ggplot2 and qqplotr libraries to plot NPP’s.
9. Data Splitting
I have used caTools library to split the dataset into train and test sets with a ratio of 80:20.
All these techniques will help you to have better insights from data and also to prepare your dataset for feeding it into a machine learning model. If you know any other techniques, share them in the comments for everyone!
Thanks For Reading, Follow Me For More
Data Preprocessing in R Markdown was originally published in Towards AI on Medium, where people are continuing the conversation by highlighting and responding to this story.
Join thousands of data leaders on the AI newsletter. Join over 80,000 subscribers and keep up to date with the latest developments in AI. From research to projects and ideas. If you are building an AI startup, an AI-related product, or a service, we invite you to consider becoming a sponsor.
Published via Towards AI
Towards AI Academy
We Build Enterprise-Grade AI. We'll Teach You to Master It Too.
15 engineers. 100,000+ students. Towards AI Academy teaches what actually survives production.
Start free — no commitment:
→ 6-Day Agentic AI Engineering Email Guide — one practical lesson per day
→ Agents Architecture Cheatsheet — 3 years of architecture decisions in 6 pages
Our courses:
→ AI Engineering Certification — 90+ lessons from project selection to deployed product. The most comprehensive practical LLM course out there.
→ Agent Engineering Course — Hands on with production agent architectures, memory, routing, and eval frameworks — built from real enterprise engagements.
→ AI for Work — Understand, evaluate, and apply AI for complex work tasks.
Note: Article content contains the views of the contributing authors and not Towards AI.
Related posts
Recent Posts


")

