


Dashboards & Stories in Tableau: A Road to Tableau Desktop Specialist Certification
Last Updated on May 30, 2022 by Editorial Team
Author(s): Daksh Trehan
Originally published on Towards AI the World’s Leading AI and Technology News and Media Company. If you are building an AI-related product or service, we invite you to consider becoming an AI sponsor. At Towards AI, we help scale AI and technology startups. Let us help you unleash your technology to the masses.
Chapter 13: A peek into Dashboards & Stories in Tableau with free Udemy Tableau Dumps
Welcome to the thirteenth chapter, In this piece, we are going to learn about Dashboards & Stories in Tableau.
If you want to navigate through other chapters, visit: Tableau: What it is? Why it is the best?; A road to Tableau Desktop Specialist Certification.
If you want to directly go on Tableau Desktop Specialist notes, access them here → https://dakshtrehan.notion.site/Tableau-Notes-c13fceda97b94bda940edbf6751cf30
Use the link to get access to free Tableau certification dumps (Valid till 20 May 2022):
Once you’re done with creating multiple visualizations, you can use them to create a dashboard. And once you’re done with creating multiple dashboards you can combine them to create a story.
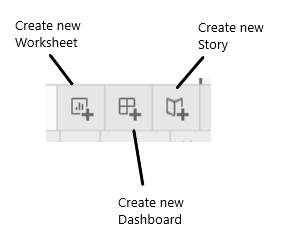
Table of Content
- Dashboards
– Layout of Dashboard
– Objects in Dashboard
– Dashboard Actions
– Best practices for creating a Dashboard
– Additional Notes - Stories
– Layout of Story
– Objects in Story
– Best practices for creating a Story
– Additional Notes - Sample Certification Questions from this Topic
Dashboards
Dashboards can be referred to as the combination of various visualizations.
Layouts of Dashboard
The layout of a Dashboard could be defined on: Phone, Tablet, Desktop, and Default.
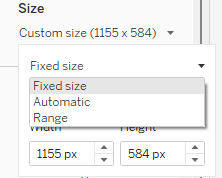
While defining the size of the Dashboard, we can choose from three options:
Fixed Size → We can define a fixed size for our dashboard, we can choose from multiple pre-defined options.
Automatic → The dashboard will automatically configure its size based on the objects it constitutes.
Range → We can give a range for the size of our dashboard.
Objects in Dashboard
In addition to our visualizations, we can also add various objects to our dashboard to increase attractiveness and make it more appealing.
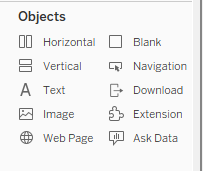
Horizontal & Vertical → These are the layout containers that let you add sheets either in horizontal or vertical format.
Text → This lets you add static text in the dashboard.
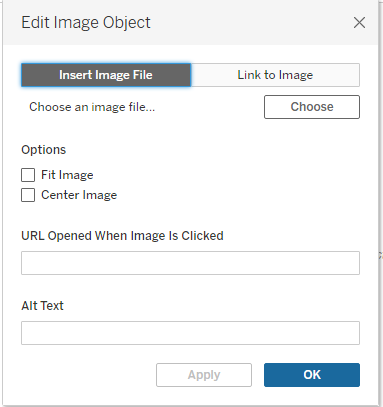
Image → We can add a background image or a static image to our dashboard using this.
Web Page → Using this object, we can add a webpage to our dashboard.
Blank → It lets you add some blank space to the dashboard.
Navigation → It would let you navigate to other dashboards or worksheets.
Downloads → It will let the audience download the dashboard in various formats.
Extension → It will let users add third-party extensions to the dashboards.
Ask Data → It lets users enter conversations that could be later answered by authors of the dashboard.
We can add our objects either in Tiled or Floating format.
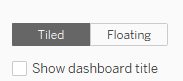
A floating format is preferred as it helps to create more appealing and optimized dashboards.
Dashboard Actions
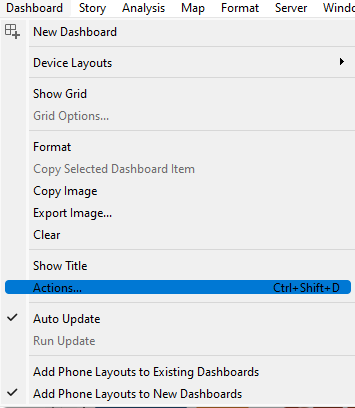
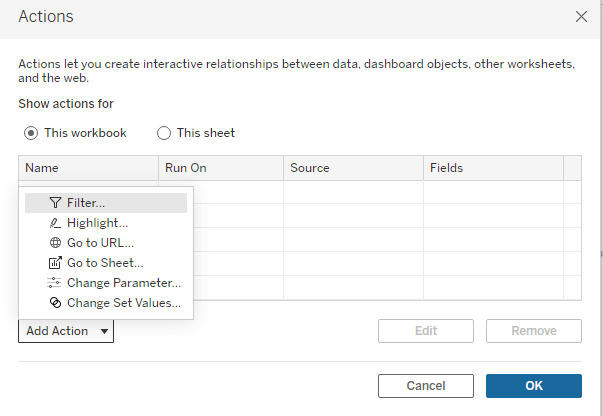
To employ Dashboard Actions, go to Dashboard>Actions.
There dashboard actions we can implement are: Filter, Highlight, Go to URL, Go to Sheet, Change Parameters, Change Set Values.
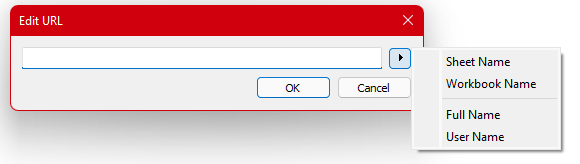
For “Go To URL”, we can specify where the link will be opened.
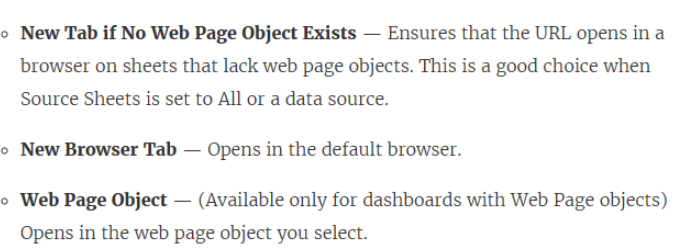
The actions could be triggered by either Hovering, Selection, Menu.
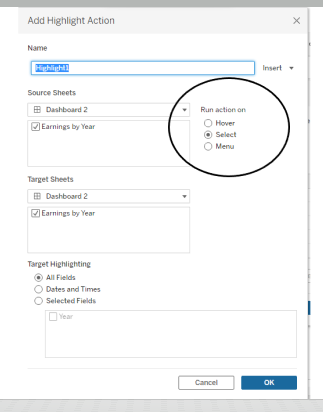
- Hover → This will change the set, once the user hovers over any mark in the view.
- Select → This will trigger the action when the user will click on any mark in the view.
- Menu → This will trigger the action when the user will right-click on the mark and select an option on the context menu.
Choose how to run the action and source and target sheets.
Best Practices for Creating a Dashboard
- Put the most important visualization in the top-left corner of the dashboard.
- By default size of the Dashboard is set to fix, make it automatic.
- Allow flexibility to users by introducing filters and parameters in the view.
- Tooltips are a great option to add extra information to your dashboard.
- Use the limited number of visualizations in a single dashboard.
- Make it crisp and concise.
Additional Notes
- While creating Filter actions, use Hovering for highlighting, selecting for filtering, and Menu action for tooltips.
- The safe URL prefixes allowed in Tableau Dashboard are HTTP, HTTPS, and FTP.
- The visualization in the tooltip is a static image, not an interactive view.
- If you use Show Me in the source sheet to change the view structure, you will reset all tooltip edits, including Viz in Tooltip references.
- We can export dashboards in jpg, png, emf, BMP format. Exporting can be done by choosing Dashboard > Export Image.
- We can’t delete a worksheet if it is present in a dashboard.
- When we modify a sheet or a dashboard the view is changed in both worksheets as well as dashboard.
Stories
Stories can be referred to as the combination of various dashboards.
Layouts of Dashboard
While defining the size of the Dashboard, we can choose from three options:
Fixed Size → We can define a fixed size for our story, we can choose from multiple pre-defined options.
Automatic → The story will automatically configure its size based on the objects it constitutes.
Range → We can give a range for the size of our story.
Objects in Stories
We can add different sheets, dashboards, or titles to our Stories.
Best Practices for Creating a Story
- Keep it crisp & concise.
- Use a chronological approach.
- Use Filters to make it interactive.
- Decrease the load time.
Additional Notes
- The delete option for a worksheet is disabled if it is being used in any story.
- If we modify any sheet used in a story, the view will also be changed in the story and vice-versa.
Sample Certification Questions from this Topic
Which of the following are the options to export the data used to build the view/visualizations? [Choose 2]
a. JSON Format
b. MS Access Database
c. CSV file
d. PDF file
Solution: CSV file, MS Access Database
Can we add a Dashboard and a Worksheet at the same time to a story point in Tableau?
a. True
b. False
Solution: False
To customize links based on your data, we can automatically enter field values as ____ in URLs.
a. Sets
b. Filters
c. Calculated Fields
d. Parameters
Solution: Parameters
Which of the following are interactive elements that can be added to a dashboard for users?
a. Filter Action
b. Edit Tooltip Action
c. Go to URL Action
d. Highlight Action
Solution: Filter Action, Go to URL Action, Highlight Action
Which of the following are valid objects when creating a dashboard in Tableau? [Choose 2]
a. Text
b. Extension
c. Video
d. Link
Solution: Text, Extension
Use the link to get access to free Tableau certification dumps (Valid till 20 May 2022):
References:
[1] Tableau Help | Tableau Software
[2] Personal Notes
[3]Tableau Desktop Specialist Exam (New Pattern — 2021) — Apisero
Thanks for Reading!
Feel free to give claps so I know how helpful this post was for you, and share it on your social networks, this would be very helpful for me.
If you like this article and want to learn more about Machine Learning, Data Science, Python, BI. Please consider subscribing to my newsletter:
Find me on Web: www.dakshtrehan.com
Connect with me at LinkedIn: www.linkedin.com/in/dakshtrehan
Read my Tech blogs: www.dakshtrehan.medium.com
Connect with me at Instagram: www.instagram.com/_daksh_trehan_
Want to learn more?
How is YouTube using AI to recommend videos?
Detecting COVID-19 Using Deep Learning
The Inescapable AI Algorithm: TikTok
GPT-3 Explained to a 5-year old.
Tinder+AI: A perfect Matchmaking?
An insider’s guide to Cartoonization using Machine Learning
How Google made “Hum to Search?”
One-line Magical code to perform EDA!
Give me 5-minutes, I’ll give you a DeepFake!
Cheers
Dashboards & Stories in Tableau: A Road to Tableau Desktop Specialist Certification was originally published in Towards AI on Medium, where people are continuing the conversation by highlighting and responding to this story.
Join thousands of data leaders on the AI newsletter. It’s free, we don’t spam, and we never share your email address. Keep up to date with the latest work in AI. From research to projects and ideas. If you are building an AI startup, an AI-related product, or a service, we invite you to consider becoming a sponsor.
Published via Towards AI
Towards AI Academy
We Build Enterprise-Grade AI. We'll Teach You to Master It Too.
15 engineers. 100,000+ students. Towards AI Academy teaches what actually survives production.
Start free — no commitment:
→ 6-Day Agentic AI Engineering Email Guide — one practical lesson per day
→ Agents Architecture Cheatsheet — 3 years of architecture decisions in 6 pages
Our courses:
→ AI Engineering Certification — 90+ lessons from project selection to deployed product. The most comprehensive practical LLM course out there.
→ Agent Engineering Course — Hands on with production agent architectures, memory, routing, and eval frameworks — built from real enterprise engagements.
→ AI for Work — Understand, evaluate, and apply AI for complex work tasks.
Note: Article content contains the views of the contributing authors and not Towards AI.
Related posts
Recent Posts


")

