Clustering using Social Graph Network
Last Updated on July 26, 2023 by Editorial Team
Author(s): Naveed Ahmed Janvekar
Originally published on Towards AI.
Data Science
A Social Graph Network can be formed when there are a set of connections between entities (nodes — such as people or organizations) and interactions (edges — such as friendship, contracts) between them. In today’s world, there are many social networks that exist — a famous one being Facebook’s friend’s network. However, as long as we can establish connections between various entities, we can represent many things around us as a social network or a graph
Benefits of social graph networks
Measures of influence such as degree centrality, eigenvector centrality can be generated from these graphs for every node. The connections or edges that a node shares with other nodes in the graph can also be represented as vectors using methodologies such as Node2Vec and these vectors can be used as features for clustering or even features for supervised learning models.
By using these vectors in supervised learning models, the objective would be to improve performance, while using them in clustering would be to find groups of nodes that share similar sub-graph structures within the entire social network. These groups can then be used for recommendations, customer segmentation, fraud detection, and so on.
What are node2vec embeddings?
Node2Vec is an algorithm developed by Aditya Grover and Jure Leskovec to represent nodes within a graph in the form of vectors. Vector representation of nodes is based on random walks within the graph. The algorithm takes inspiration from the workings of word2vec. These vectors can then be used in other machine learning tasks such as features in supervised or unsupervised learning. More details of the algorithm can be found here https://arxiv.org/pdf/1607.00653.pdf
Implementation of node2vec on a social network graph
In this article node2vec algorithm is implemented on a network graph that is generated from the SNAP Dataset Facebook Gemsec dataset. https://snap.stanford.edu/data/gemsec-Facebook.html . This dataset represents blue verified Facebook page networks of different athletes. Nodes represent the pages of athletes and edges are mutual likes among them.
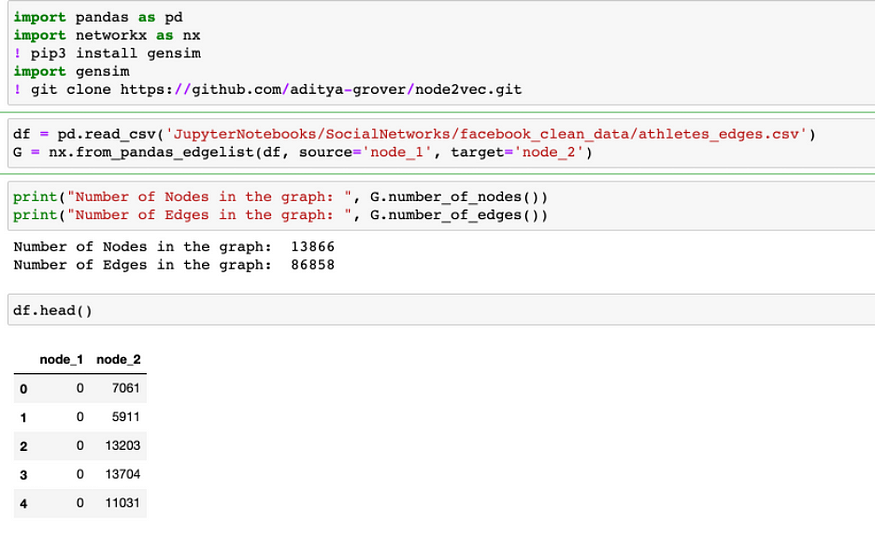
Step1: Import necessary packages and read data into a pandas data frame

There are 13K nodes and 86K edges between them.
Step 2: Running Node2Vec on the edge list which is extracted from the pandas data frame. An edge is a relationship connecting nodes. A graph object is created from this edge list. To create the graph object we use the networkx package.
Below commands will generate embeddings with 64 dimensions, and this is a parameter that can be optimized for.


Step 3: Embeddings for all the nodes in the graph is extracted and stored in a pandas data frame

Step 4: Clustering: On running a K-Means clustering we get distinct clusters/communities which we will later on use to visualize these embeddings. For this article we are assuming 5 clusters, however, there are methods such as scree plot to identify an optimal number of clusters for K-Means.

Visualization embedding and clustering results:
To get a visual perspective of the embeddings generated we reduce the dimensions using Principal Component Analysis (PCA), and combine the generated dimensions with the clusters from the above step. Make sure to remove the cluster column before running PCA.


From the above plot, we can visualize 5 different clusters or communities that can be extracted by generating embedding vectors from graph networks. These clusters can now be used to further deep dive for tasks such as customer segmentation.
Join thousands of data leaders on the AI newsletter. Join over 80,000 subscribers and keep up to date with the latest developments in AI. From research to projects and ideas. If you are building an AI startup, an AI-related product, or a service, we invite you to consider becoming a sponsor.
Published via Towards AI
Take our 90+ lesson From Beginner to Advanced LLM Developer Certification: From choosing a project to deploying a working product this is the most comprehensive and practical LLM course out there!
Towards AI has published Building LLMs for Production—our 470+ page guide to mastering LLMs with practical projects and expert insights!

Discover Your Dream AI Career at Towards AI Jobs
Towards AI has built a jobs board tailored specifically to Machine Learning and Data Science Jobs and Skills. Our software searches for live AI jobs each hour, labels and categorises them and makes them easily searchable. Explore over 40,000 live jobs today with Towards AI Jobs!
Note: Content contains the views of the contributing authors and not Towards AI.


