


Clustering Custom Data Using the K-Means Algorithm — Python
Last Updated on March 29, 2021 by Editorial Team
Author(s): Jayashree domala
Machine Learning
Clustering Custom Data Using the K-Means Algorithm — Python
A guide to understanding and implementing the K-means algorithm using Python.
What is the K-Means clustering algorithm?
The K-Means clustering algorithm is an unsupervised learning algorithm meaning that it has no target labels. This algorithm groups the similar clusters together.
Where is clustering used in the real world?
The various applications of the clustering algorithm are:
- Market segmentation
- Grouping of customers based on features
- Clustering of similar documents
How does the algorithm work?
The algorithm follows the given steps:
- Choose a number of clusters “K”.
- Then each point in the data is randomly assigned to a cluster.
- Repeat the next steps until clusters stop changing:
a) Calculate the centroid of the cluster by making the mean vector of points in the cluster, for each cluster.
b) Assign each data point to the cluster for which the centroid is the closest.
How to choose the value of “K”?
It is very tricky to choose the best “K” value. But one way of doing it is the elbow method. According to this method, the sum of squared error (SSE) is calculated for some values of “K”. The SSE is the sum of the squared distance between each data point of cluster and its centroid. When “k” is plotted against SSE, the error decreases as “K” gets larger. The reason being that when the cluster number increases, their size decreases and therefore the distortion is also smaller. So the elbow method states that the value of “K” will be the one at which the SSE decreases abruptly. It produces an “elbow effect”.
How to implement using Python?
The dataset for clustering will be created. Using the sci-kt learn package a random dataset will be formed on which the algorithm will be run.
→ Import packages
The numpy library is imported to handle data along with matplotlib to help with data visualization.
>>> import numpy as np
>>> import matplotlib.pyplot as plt
>>> %matplotlib inline
→ Create data
The “make_blobs” method of the sklearn package will be used. The number of samples, features, centers and cluster standard deviation will be set as parameters.
>>> from sklearn.datasets import make_blobs
>>> data = make_blobs(n_samples=400, n_features=2, centers=5, cluster_std=1.8)
>>> data[0].shape
(400, 2)
→ Plotting the blobs
The scatter plot of all the rows of the first column is plotted against all the rows of the second column. Then the cluster number labels are provided to see the different clusters.
>>> plt.scatter(data[0][:,0],data[0][:,1],c=data[1],cmap='rainbow')
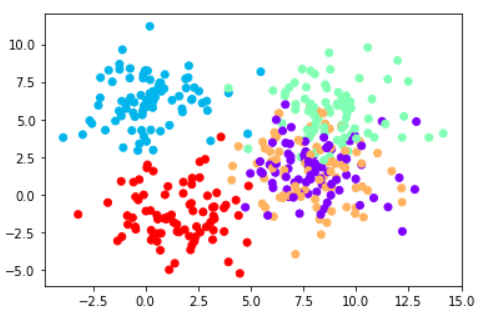
So here the clusters are distorted and overlapping. Using the K-means algorithm, clustering will be performed to group the data properly.
→ Build model
The KMeans module is imported from sklearn to build the model. The KMeans object is created and the parameter ‘k’ is passed to the object. Here there are 5 clusters. Then it is fit on the data.
>>> from sklearn.cluster import KMeans
>>> model = KMeans(n_clusters=5)
>>> model.fit(data[0])
KMeans(n_clusters=5)
The cluster centers and the predicted labels can be obtained.
>>> model.cluster_centers_
array([[ 9.07898265,  5.31380282],
       [ 0.09832752,  6.25299731],
       [ 1.47946328, -1.483289  ],
       [ 8.66272519,  0.43529401],
       [ 6.1742668 ,  2.5718236 ]])
>>> model.labels_
array([1, 3, 2, 1, 1, 2, 4, 4, 3, 1, 4, 2, 1, 2, 3, 0, 0, 0, 3, 0, 3, 0,
       0, 3, 3, 4, 0, 0, 3, 0, 2, 4, 3, 2, 1, 1, 2, 4, 4, 0, 3, 4, 4, 2,
       3, 1, 4, 3, 0, 0, 3, 0, 0, 3, 1, 0, 0, 0, 0, 0, 4, 3, 2, 1, 0, 3,
       2, 1, 2, 1, 3, 1, 4, 1, 4, 0, 2, 4, 2, 2, 3, 3, 1, 3, 1, 2, 0, 3,
       0, 3, 2, 0, 0, 1, 1, 0, 2, 2, 1, 4, 4, 1, 3, 1, 2, 2, 0, 1, 1, 1,
       0, 4, 3, 1, 3, 3, 2, 4, 1, 0, 3, 0, 4, 2, 1, 0, 2, 1, 3, 3, 3, 2,
       3, 3, 1, 1, 1, 3, 2, 0, 0, 2, 4, 1, 1, 0, 1, 0, 0, 0, 4, 1, 0, 0,
       4, 2, 2, 0, 0, 2, 2, 3, 0, 4, 1, 1, 2, 4, 3, 0, 0, 0, 1, 0, 0, 1,
       2, 1, 3, 2, 1, 0, 1, 3, 4, 4, 1, 1, 3, 3, 1, 3, 3, 4, 2, 3, 3, 2,
       4, 0, 2, 2, 3, 3, 4, 2, 1, 1, 3, 0, 0, 3, 2, 3, 3, 2, 2, 0, 3, 2,
       0, 3, 2, 4, 3, 0, 4, 4, 0, 3, 3, 1, 0, 0, 1, 0, 3, 1, 2, 2, 2, 2,
       0, 3, 2, 4, 0, 4, 4, 4, 2, 0, 4, 1, 0, 3, 2, 3, 2, 2, 3, 1, 4, 0,
       2, 3, 3, 4, 3, 1, 4, 2, 1, 0, 3, 2, 0, 4, 0, 3, 2, 2, 2, 4, 2, 2,
       2, 1, 1, 0, 4, 1, 0, 2, 0, 4, 0, 1, 0, 1, 0, 3, 3, 1, 0, 2, 3, 0,
       0, 4, 2, 3, 0, 1, 3, 4, 3, 3, 0, 1, 4, 2, 4, 4, 0, 0, 0, 1, 2, 1,
       2, 4, 3, 0, 0, 4, 4, 1, 0, 3, 4, 2, 1, 3, 0, 0, 4, 1, 0, 4, 1, 4,
       3, 0, 0, 2, 1, 3, 2, 2, 2, 3, 1, 1, 0, 1, 0, 4, 0, 0, 3, 3, 0, 3,
       4, 1, 0, 3, 2, 3, 0, 0, 3, 1, 1, 2, 1, 4, 1, 3, 4, 4, 3, 3, 2, 2,
       2, 0, 1, 3])
Here the model has predicted the labels and since being an unsupervised learning algorithm, if real-world data is taken, there would be no target labels to compare with. Since the data is created here, the target labels can be compared with the predicted ones to see how well the K-Means algorithm works.
>>> f, (ax1, ax2) = plt.subplots(1, 2, sharey=True,figsize=(10,6))
>>> ax1.set_title('K Means clusters')
>>> ax1.scatter(data[0][:,0],data[0[:,1],c=model.labels_,cmap='rainbow')
>>> ax2.set_title("Original clusters")
>>> ax2.scatter(data[0][:,0],data[0][:,1],c=data[1],cmap='rainbow')
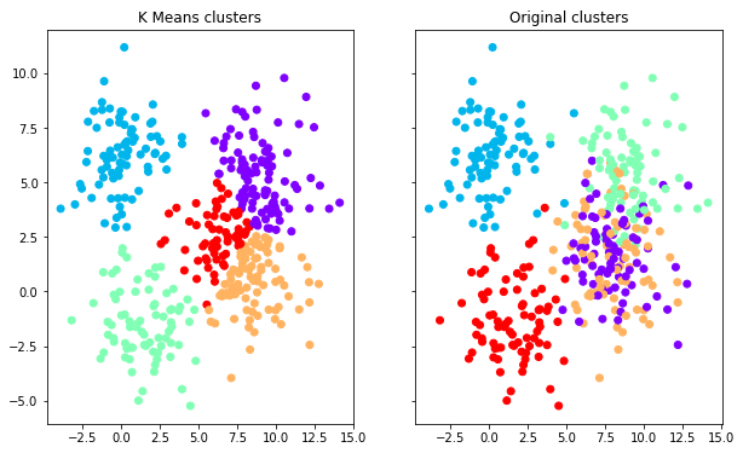
It can be observed that the K-Means algorithm creates more defined clusters.
Refer to the notebook here.
Reach out to me: LinkedIn
Check out my other work: GitHub
Clustering Custom Data Using the K-Means Algorithm — Python was originally published in Towards AI on Medium, where people are continuing the conversation by highlighting and responding to this story.
Published via Towards AI
Towards AI Academy
We Build Enterprise-Grade AI. We'll Teach You to Master It Too.
15 engineers. 100,000+ students. Towards AI Academy teaches what actually survives production.
Start free — no commitment:
→ 6-Day Agentic AI Engineering Email Guide — one practical lesson per day
→ Agents Architecture Cheatsheet — 3 years of architecture decisions in 6 pages
Our courses:
→ AI Engineering Certification — 90+ lessons from project selection to deployed product. The most comprehensive practical LLM course out there.
→ Agent Engineering Course — Hands on with production agent architectures, memory, routing, and eval frameworks — built from real enterprise engagements.
→ AI for Work — Understand, evaluate, and apply AI for complex work tasks.
Note: Article content contains the views of the contributing authors and not Towards AI.
Related posts
Recent Posts


")

