


All About K-Means Clustering
Last Updated on May 30, 2022 by Editorial Team
Author(s): Akash Dawari
Originally published on Towards AI the World’s Leading AI and Technology News and Media Company. If you are building an AI-related product or service, we invite you to consider becoming an AI sponsor. At Towards AI, we help scale AI and technology startups. Let us help you unleash your technology to the masses.
In this article we will understand a clustering algorithm by answering the following question:
- What is clustering?
- What are the real-world applications of clustering?
- How does K-means Clustering work?
- How can we find the value of K?
- What are the advantages and disadvantages of K-Means Clustering?
- How to implement K-Means Clustering?
What is Clustering?
The classic definition will be:
“Clustering is an unsupervised machine learning technique which finds certain patterns/structures in the unlabeled data to segregate them into different groups, according to their properties.”
To understand the definition let's take an example: In a library, the books are organized in a particular way so that when an individual look for a specific book, he/she could find it. So, to organize these books, they are grouped together by their similar properties. This technique of grouping different elements by their similar properties and behavior is known as clustering.
What are the real-world applications of clustering?
Different clustering techniques are used to solve the real-world challenges faced in day-to-day life. Some of the applications are as follows:
- For customer segmentation: You can cluster your customers based on their purchases, their activity on your website, and so on. This is useful to understand who your customers are and what they need, so you can adapt your products and marketing campaigns to each segment. For example, this can be useful in recommender systems to suggest content that other users in the same cluster enjoyed.
- For data analysis: When analyzing a new dataset, it is often useful to first discover clusters of similar instances, as it is often easier to analyze clusters separately.
- As a dimensionality reduction technique: Once a dataset has been clustered, it is usually possible to measure each instance’s affinity with each cluster (affinity is any measure of how well an instance fits into a cluster). Each instance’s feature vector x can then be replaced with the vector of its cluster affinities. If there are k clusters, then this vector is k dimensional. This is typically much lower-dimensional than the original feature vector, but it can preserve enough information for further processing.
- For anomaly detection (also called outlier detection): Any instance that has a low affinity to all the clusters is likely to be an anomaly. For example, if you have clustered the users of your website based on their behavior, you can detect users with unusual behavior, such as an unusual number of requests per second, and so on. Anomaly detection is particularly useful in detecting defects in manufacturing, or for fraud detection.
- For semi-supervised learning: If you only have a few labels, you could perform clustering and propagate the labels to all the instances in the same cluster. This can greatly increase the number of labels available for a subsequent supervised learning algorithm and thus improve its performance.
- For search engines: For example, some search engines let you search for images that are similar to a reference image. To build such a system, you would first apply a clustering algorithm to all the images in your database: similar images would end up in the same cluster. Then when a user provides a reference image, all you need to do is to find this image’s cluster using the trained clustering model, and you can then simply return all the images from this cluster.
- To segment an image: By clustering pixels according to their color, then replacing each pixel’s color with the mean color of its cluster, it is possible to reduce the number of different colors in the image considerably. This technique is used in many object detection and tracking systems, as it makes it easier to detect the contour of each object.
How does K-means Clustering work?
K-Means is a clustering approach in which the data is grouped into K distinct non-overlapping clusters based on their distances from the K centers. The value of K needs to be specified first and then the algorithm assigns the points to exactly one cluster.
Algorithm:
- Randomly assign K centers.
- Calculate the distance of all the points from all the K centers and allocate the points to the cluster based on the shortest distance. The model’s inertia is the mean squared distance between each instance and its closest centroid. The goal is to have a model with the lowest inertia.
- Once all the points are assigned to clusters, recompute the centroids.
- Repeat steps 2 and 3 until the locations of the centroids stop changing and the cluster allocation of the points becomes constant.
The algorithm of K-Means Clustering is pretty straightforward. So, now let's visualize what we have discussed in the algorithm so to better understand it.
The first step is to assign the value of k. The value of k indicates the number of groups we want to segregate our data.
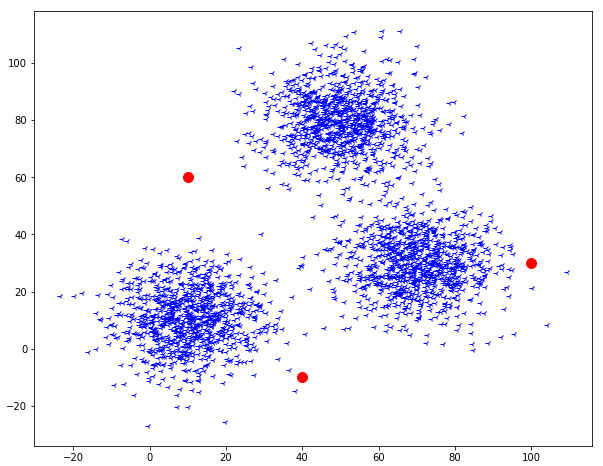
Here we have assigned the value of k = 3. This means we have generated three random centroids based on which we segregate our data.
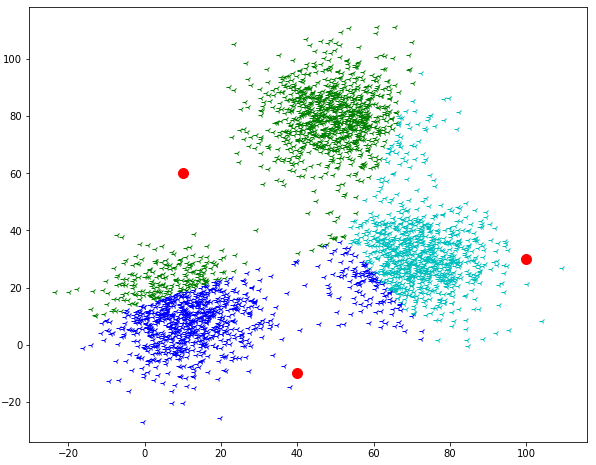
The second step Now we have to calculate the distance of every data point with respect to each centroid, we have introduced. Then select the nearest centroids and assign a group.
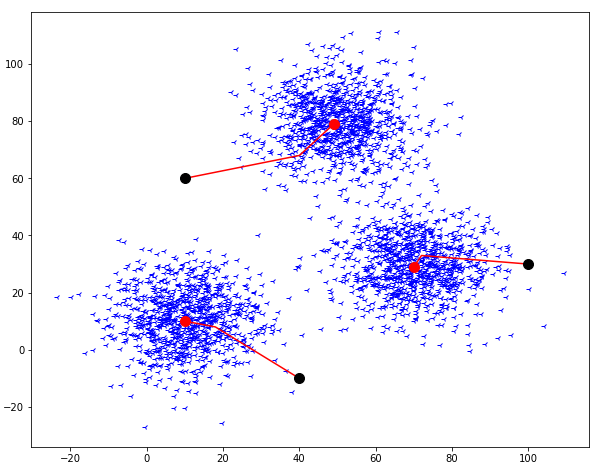
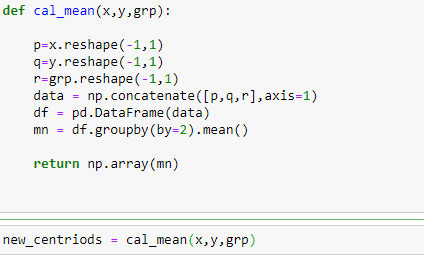
The third step is to recalculate the coordinates of the centroids we have introduced. This step can be done by calculating the mean of the points which are assigned to the respective centroid.

The fourth step is to repeat the step second and third until the coordinates of the centroids stop moving.
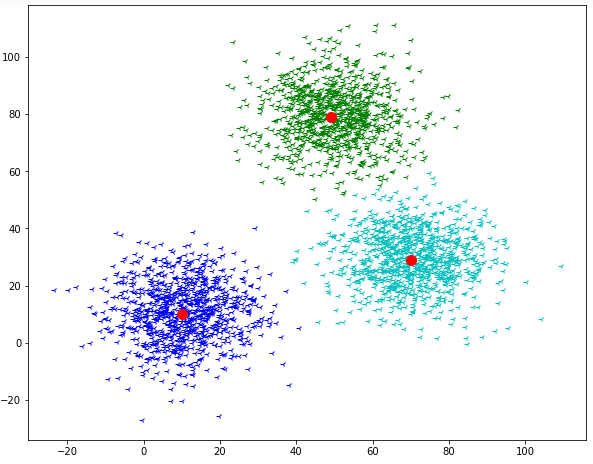
So, the final output will look like this:
So, we have also visualized the core intuition of k-means clustering. But there is still one question we have to answer how can we decide the value of k. so, let's see how?
How can we find the value of K?
The value of K can be found with the help of one method which is The Elbow-Method. Let see now what Is this elbow method all about.
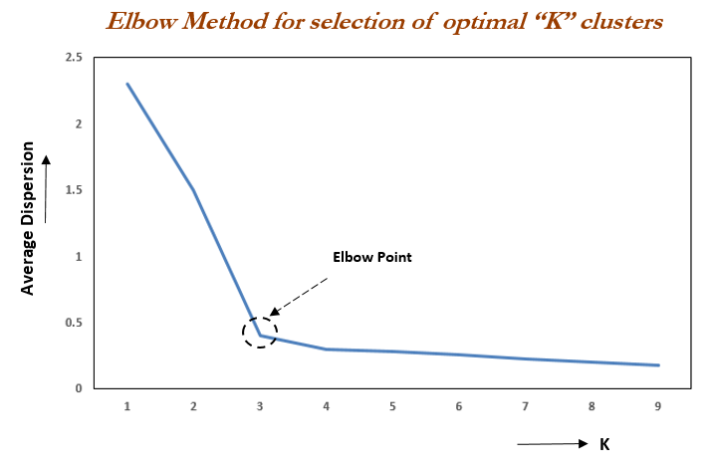
This method is based on the relationship between the within-cluster sum of squared distances(WCSS Or Inertia) and the number of clusters. It is observed that first with an increase in the number of clusters WCSS decreases steeply and then after a certain number of clusters the drop in WCSS is not that prominent. The point after which the graph between WCSS and the number of clusters becomes comparatively smother is termed the elbow and the number of clusters at that point is the optimum number of clusters as even after increasing the clusters after that point the variation is not decreased by much.
What are the advantages and disadvantages of K-Means Clustering?
Advantages:
- This algorithm is very easy to understand and implement.
- This algorithm is efficient, Robust, and Flexible
- If data sets are distinct and spherical clusters, then give the best results
Disadvantages:
- This algorithm needs prior specification for the number of cluster centers that is the value of K.
- It cannot handle outliers and noisy data, as the centroids get deflected
- It does not work well with a very large set of datasets as it takes huge computational time.
How to implement K-Means Clustering?
The implementation of K-Means Clustering is very easy, just have to follow the algorithm which we have discussed above.
NOTE: The below k-means code is from scratch. I did not use scikit-learn library to build the code.
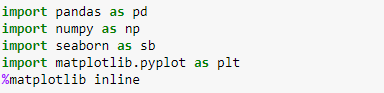
First, let’s import the import packages from python to get started.
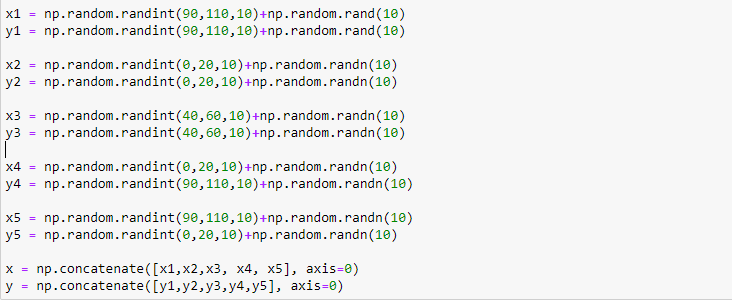
Now, create a toy dataset.
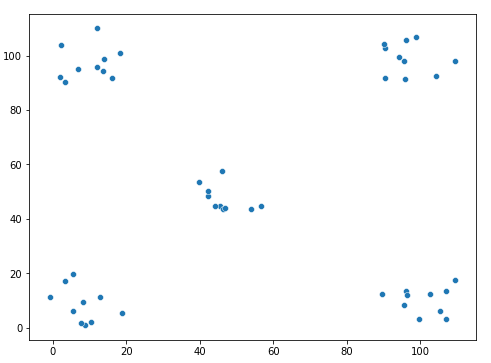
visualize our toy dataset
Step-1: Initialize the value of K i.e. create 5 random centroids
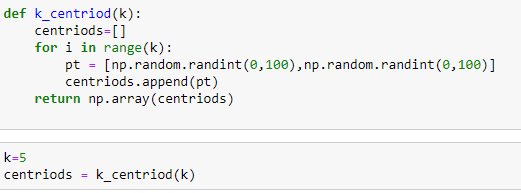
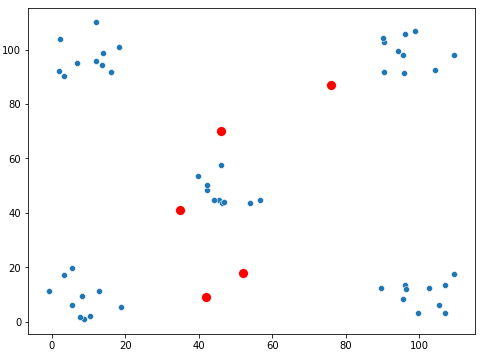
Visualize the centroids.
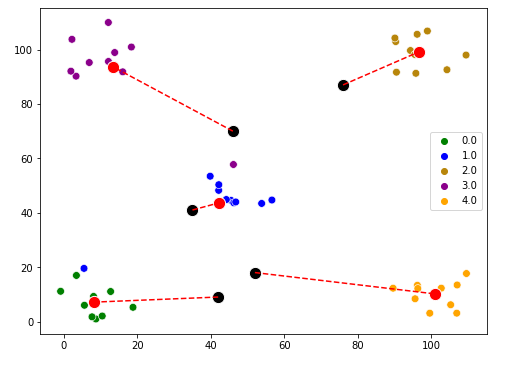
Step 2: calculate the distance of every data point to the centroids and assign the nearest centroid.
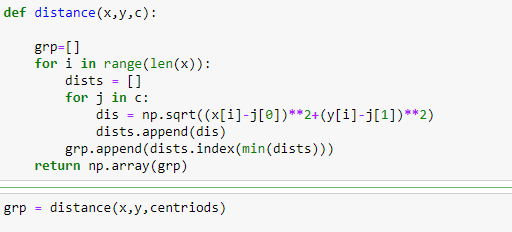
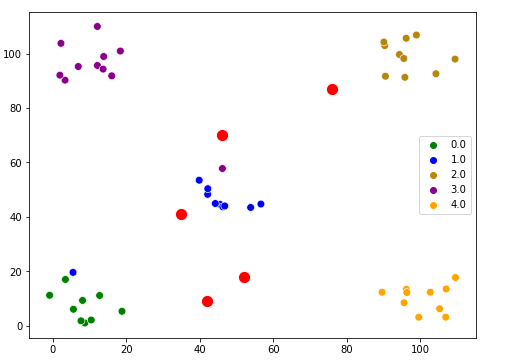
Visualize the data and how they are grouped with the centroids.
Step 3: calculate the mean for every group and assign it to the centroid to create new centroids.
Visualize the new centroids.
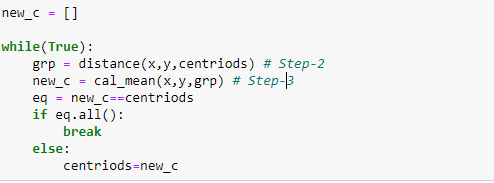
Step 4: Now just repeat the 2nd and 3rd step until centroids stop changing.
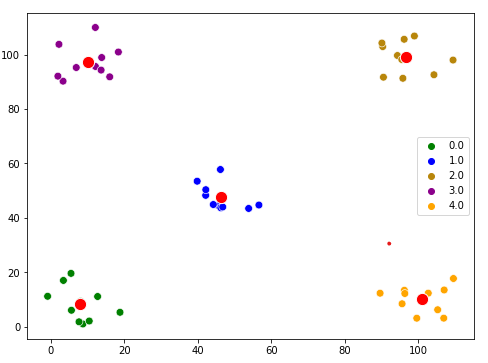
Visualize the final clustering.
link of the notebook used in this article:
Articles_Blogs_Content/K-Means Clustering.ipynb at main · Akashdawari/Articles_Blogs_Content
Like and Share if you find this article helpful. Also, follow me on medium for more content related to Machine Learning and Deep Learning.
All About K-Means Clustering was originally published in Towards AI on Medium, where people are continuing the conversation by highlighting and responding to this story.
Join thousands of data leaders on the AI newsletter. It’s free, we don’t spam, and we never share your email address. Keep up to date with the latest work in AI. From research to projects and ideas. If you are building an AI startup, an AI-related product, or a service, we invite you to consider becoming a sponsor.
Published via Towards AI
Towards AI Academy
We Build Enterprise-Grade AI. We'll Teach You to Master It Too.
15 engineers. 100,000+ students. Towards AI Academy teaches what actually survives production.
Start free — no commitment:
→ 6-Day Agentic AI Engineering Email Guide — one practical lesson per day
→ Agents Architecture Cheatsheet — 3 years of architecture decisions in 6 pages
Our courses:
→ AI Engineering Certification — 90+ lessons from project selection to deployed product. The most comprehensive practical LLM course out there.
→ Agent Engineering Course — Hands on with production agent architectures, memory, routing, and eval frameworks — built from real enterprise engagements.
→ AI for Work — Understand, evaluate, and apply AI for complex work tasks.
Note: Article content contains the views of the contributing authors and not Towards AI.
Related posts
Recent Posts


")

