


7 Ways to Identify and Handle Missing Data | 3 Ways You Should Not
Last Updated on October 4, 2021 by Editorial Team
Author(s): Raja Dev
Data Science
10 Strategies to Prepare High-Quality Data for ML
Good Data Scientists acknowledge the reasons behind data unavailability, establishes the scope of missing data, handle the gaps with the right strategy, and avoid common mistakes.
This story is written for those who wants to understand the concept of missing data, the reasons behind and the strategies we’ve to handle it – without mixing the theory with any programming constructs.
Let’s Start
“Go straight for ___ meters and turn ____ at the second cross”, imagine how would a car driver run crazy, if a navigator directs him/her with some missing data. Nobody likes to see the data missing in their datasets. Missing Data impacts the consumer applications and leaves the users inconclusive on any decisions.

It’s the same case with the data scientists. We too do not like to see the data missing in the data sets, because it makes the raw data not suitable to train our underlying machine learning algorithms.
What could be the reasons for missing data?
How come only certain parts of the data go missing, while all others are available! Let’s take a brief look into that before strategizing.
Missing data is unavoidable, due to several reasons like:
- Malfunctioning of the data collection devices.
Eg: Thermometers at the weather stations. If dust collects on the thermometer, it may stop recording the temperature for a short duration until someone notices it and clears the dust. - Gaps in conducting a survey, due to lack of knowledge from the field staff.
Eg: While screening the applicants on phone calls, a new recruiter might miss asking certain details like — bonus amount received by the applicant in their last appraisal. - Optionally omitted by the respondents while filling a form.
Eg: Some customers may not wish to provide certain demographic details like Age, Gender, or Income in the feedback forms.

4. Explicitly removing certain fields from the data due to security or confidentiality reasons.
Eg: To maintain confidentiality, before distributing the data, the organization may remove the details of the Sales Commission paid to certain high-value partners.
Whatever be the reasons, missing data impacts the ability of the algorithms to learn from the data. And the Data Scientist must detect them and resolve them before defining any training model. That’s the Need.
How to detect the presence of missing data in your dataset?
Determining the missing parts is essential to think of handling it.
There are primarily 5 ways to detect the presence of missing data:

- Check for the presence of null or empty values in a column.
- Check for the count match. If the count of values in a column is not matching with the count of rows in the dataset, then the column should be having some values missing.
- Look for homogeneity of the values in a column. Though the counts match, some values could be corrupted.
Eg: ‘Twenty dollars’ is written in the place of $20. - Look for the presence of any invalid values in a column.
Are the numeric values within the specified range?
Are the categorical values with the defined list? - Find out the outliers at the individual column level. Yes, I recommend the outliers should also be treated as missing data.
After determining the presence of missing data, the next task is to define a strategy to handle that.
How to handle the missing data?
At a high level, all strategies fall into two categories: either eliminate or replace the missing data.
Strategy 1: Delete all the rows that contain at least one missing value.
A pseudo algorithm would look like this:
for col in columns:
  for row in rows:
    if value is {null, blank or invalid}
      delete row
    end if
   end for
end for
This strategy can incur a significant data loss, so it has to be used judiciously. It suits well when the data volume is large and the missing values are randomly distributed across the dataset.
Random distribution makes sure that the deletion of certain rows, doesn’t introduce bias into the dataset.
Eg: Only one among 10 thermometers, placed at a unique location, failed to record the temperature for 30minutes in a day. If all the readings of one specific thermometer are removed from the dataset, it may introduce bias against the point of measurement, where this thermometer was positioned.
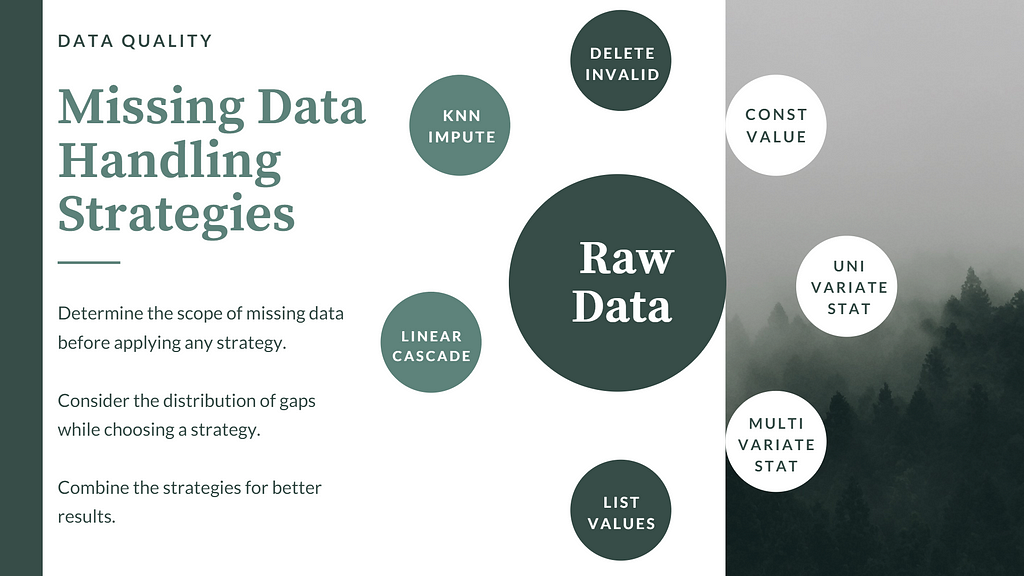
Strategy 2: Replace with a constant default value.
This strategy is easy to implement and suits both the continuous and categorical variables.
Example:
Clinical Dataset: Boolean column ‘Available?’ denoting the availability of the Physician on a certain date. If the value is blank/null/invalid, replace it with the value as ‘False’.
Project Management Dataset: If the ‘Planned Start Date’ of activity is missing, replace it with the ‘Project Start Date’ which is a constant.
Strategy 3: Replace with a Univariate Statistic
Estimate a new value, as a function of available values in that feature. If it is a numeric feature, that function could be mean, median or mode, etc. In the case of a categorical feature, it could be a function that returns the most frequent value.
Example:
Recruitment Drive Dataset: If the value of ‘expected salary’ is missing for an applicant, replace it with the mean of the ‘expected salary’ feature.
Strategy 4: Replace with a Multivariate Statistic
In this strategy, the value is estimated as a function of other values available in the same row. It’s a horizontal calculation across multiple features.
Example:
Recruitment Drive Dataset: If the value of ‘notice period’ is missing for an applicant, derive it from the ‘resignation date’ of the candidate.
Strategy 5: Iterative Replacement
If you think, replacing all missing values with a single constant introduces a bias into the dataset, then Iterative Replacement is a good strategy to counter that.
Instead of defining a single default constant for a feature, you would define a list of constants that can be considered for replacement. Iterate through the feature and replace each missing value with a constant from this list in a round-robin fashion.
Example:
If ‘favorite color’ is missing in the data for 50 customers. Iterate over the list of customers and fill it with one among {red, green, blue} in a round-robin fashion.
Strategy 6: Linear Forward or Backward
If you think, the immediate neighbor provides more reliable information than the rest of the rows, then this strategy is apt.
Iterate through a feature, whenever you encounter a missing value, copy the value from the previous row to the current row. Here the Iteration can be either forward (top-down) or backward (bottom-up).
Example:
Retail Store Sale Transactions: If the Batch Id is missing for an item, take the Batch Id of the previous item.
Workplace Access Control Log: If Exit Time is missing for an employee, cascade back the Exit Time of the next employee who has checked out.
Strategy 7: Considering Multiple Nearest Neighbors
This is a tradeoff between Strategy 6 and Strategy 2. Estimate the value as a function of more than one nearest neighbor.
This strategy is more suitable for the scenarios, where the combination of k-Nearest Neighbors is more reliable than a single immediate neighbor. It avoids long cascading of any error in the nearest neighbor.
Set a value for k and calculate the mean of the previous k values and fill the missing value. If the correlation varies with the proximity of the neighbor, then calculate the weighted mean instead of the normal mean.
Example:
Clinical Data: ‘wait time’ denotes how long was a patient waiting in the room before getting a chance to consult the physician. If ‘wait time’ is missing for a patient, then it is a good idea to derive it from multiple patients who have consulted the physician before or after that patient.
There is a possibility that the previous patient (n-1) might have exceptionally waited long. If we do a linear forward here (strategy 6), there is a chance of cascading and amplifying the error in the dataset. Instead, if we take the weighted mean of the previous 3 patients, then the error gets minimized and limited to the current patient.
What are the common mistakes to avoid?
Let’s have a close look at some of the common mistakes while handling the missing data and the best practices to avoid them.
- Avoid Outliers & Invalid Data
Make sure that you are considering outliers and invalid data also as Missing Data. Detect and Nullify them before starting to replace the missing data.
If you don’t do that, the outliers would influence the prediction functions and you may end up replacing the Missing Data with some inaccurate or biased values. - Do Not Ignore the Distribution
Deleting the missing values is advised only when those missing values are randomly distributed in a feature. If the reason for missing is logically connected to any other attribute or feature, then the rows have to be collaboratively deleted.
Example:
Climate Data: If all the missing values of ‘temperature’ are mapped to a specific thermometer, then you should not explicitly delete these rows. First, try to estimate those values using other parts of the data. If the estimation is not possible, then delete all the rows of that malfunctioned thermometer. Though it may contain some rows with correct values, those rows should also be deleted in collaboration with the missing values, to avoid intrinsic bias. - Do not Stick to a Single Estimation Method
The main purpose of handling the Missing Values is to increase Data Quality. Use the best estimation method that provides the best accuracy in estimating the missing values.
How do you know, whether the selected estimation method is the best one or not?
That you would come to know, only after training the model and validating the model's accuracy. Keeping the algorithm and all other things constant, repeat the process of data preparation, training, and validation. This time, using a different estimation method for replacing the Missing Values. The difference in models accuracy can be attributed to the difference in the selection of the Missing Value Estimation Method. Repeat this process, till you arrive at the best estimation method.
To Summarize:
The article explains the four elements in the story of handling missing data.
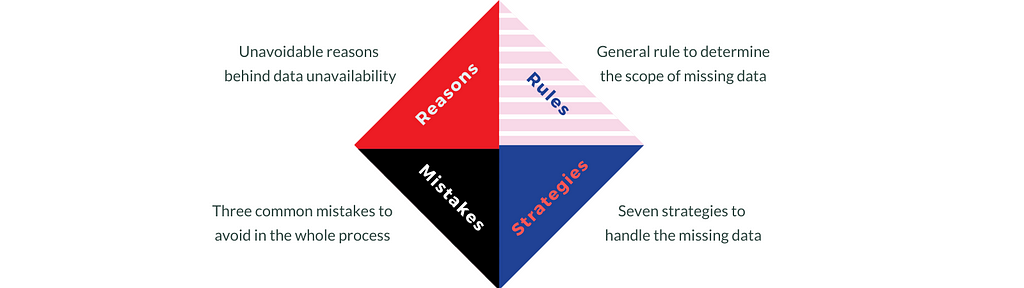
Data Quality is critical to train the ML algorithms for accuracy. Missing data is unavoidable due to several reasons in the collection process. Determining the scope of missing values, including outliers and invalid data is very important before applying any replacement techniques. Seven strategies were discussed to handle the missing values, along with examples that indicate the suitable business contexts. Start by choosing one among them and repeat the exercise till you see the best accuracy in the model out. And we are done 👏 👏.
7 Ways to Identify and Handle Missing Data | 3 Ways You Should Not was originally published in Towards AI on Medium, where people are continuing the conversation by highlighting and responding to this story.
Published via Towards AI
Towards AI Academy
We Build Enterprise-Grade AI. We'll Teach You to Master It Too.
15 engineers. 100,000+ students. Towards AI Academy teaches what actually survives production.
Start free — no commitment:
→ 6-Day Agentic AI Engineering Email Guide — one practical lesson per day
→ Agents Architecture Cheatsheet — 3 years of architecture decisions in 6 pages
Our courses:
→ AI Engineering Certification — 90+ lessons from project selection to deployed product. The most comprehensive practical LLM course out there.
→ Agent Engineering Course — Hands on with production agent architectures, memory, routing, and eval frameworks — built from real enterprise engagements.
→ AI for Work — Understand, evaluate, and apply AI for complex work tasks.
Note: Article content contains the views of the contributing authors and not Towards AI.
Related posts
Recent Posts


")

