


3 Reasons You Should Avoid Pie Plots At All Costs
Last Updated on January 11, 2023 by Editorial Team
Author(s): Filipe Filardi
Originally published on Towards AI.
3 Reasons You Should Avoid Pie Plots At All Costs
The case against pie plots and a look at the alternatives
Pie Plots are a popular choice for data visualization because they are easy to create and understand. However, there are three main reasons you should avoid using Pie Plots.
3. They can be difficult to read accurately
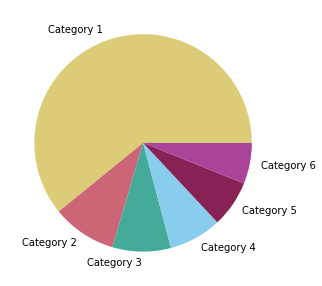
One of the main problems with pie plots is that it can be difficult for the human eye to compare the slices' sizes accurately. This is because the angles of the slices are not a good representation of the proportions being shown.
Here’s an example of a Pie Plot in which you can’t comprehend the difference between the small categories visually:
You can reproduce the plot with the following code:
import matplotlib.pyplot as plt

plt.figure(figsize=(8, 5))
plt.pie(
    x=[350, 55, 50, 45, 40, 35],
    labels=['Category 1', 'Category 2', 'Category 3', 'Category 4', 'Category 5', 'Category 6'],
    colors=['#DDCC77', '#CC6677', '#44AA99', '#88CCEE', '#882255', '#AA4499']
)

plt.show()
Some say Donut Plots (Pie Plots with a hole in the center) can be easier to read because the viewer is not required to compare angles. But at best, it will make it a little easier for similar segments. You still won’t be able to compare proportions!
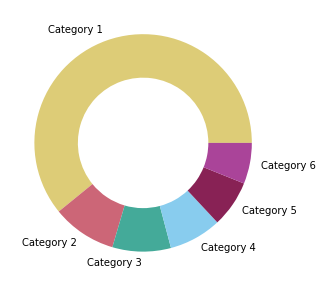
To create a Donut Plot, you can use the pie() function with the additional wedgeprops argument:
import matplotlib.pyplot as plt

plt.figure(figsize=(8, 5))
plt.pie(
    x=[350, 55, 50, 45, 40, 35],
    labels=['Category 1', 'Category 2', 'Category 3', 'Category 4', 'Category 5', 'Category 6'],
    colors=['#DDCC77', '#CC6677', '#44AA99', '#88CCEE', '#882255', '#AA4499'],
    wedgeprops={'width': 0.4}
)

plt.show()
2. They can be misleading
Another issue with pie plots is that they can be easily manipulated to give a false impression of the data. Can you tell which category has the biggest values in the following plots?
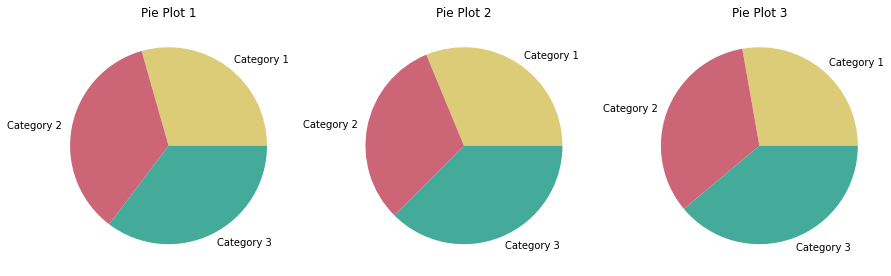
If you can’t tell by looking, you can imagine how these plots can be used to manipulate information, especially when they’re plotted side by side, like in the example above.
You can check the values for each plot and reproduce them with the following code:
import matplotlib.pyplot as plt

fig, (ax1, ax2, ax3) = plt.subplots(1, 3, figsize=(15, 8))

ax1.pie(
    x=[25, 30, 30],
    labels=['Category 1', 'Category 2', 'Category 3'],
    colors=['#DDCC77', '#CC6677', '#44AA99']
)

ax2.pie(
    x=[25, 25, 30],
    labels=['Category 1', 'Category 2', 'Category 3'],
    colors=['#DDCC77', '#CC6677', '#44AA99']
)

ax3.pie(
    x=[25, 30, 35],
    labels=['Category 1', 'Category 2', 'Category 3'],
    colors=['#DDCC77', '#CC6677', '#44AA99']
)

ax1.set_title('Pie Plot 1')
ax2.set_title('Pie Plot 2')
ax3.set_title('Pie Plot 3')

plt.show()
1. There are better alternatives
You have a whole gallery of easier-to-read plots in your disposition. For example, Bar Plots can show proportions and be much easier to read and interpret than Pie Plots.
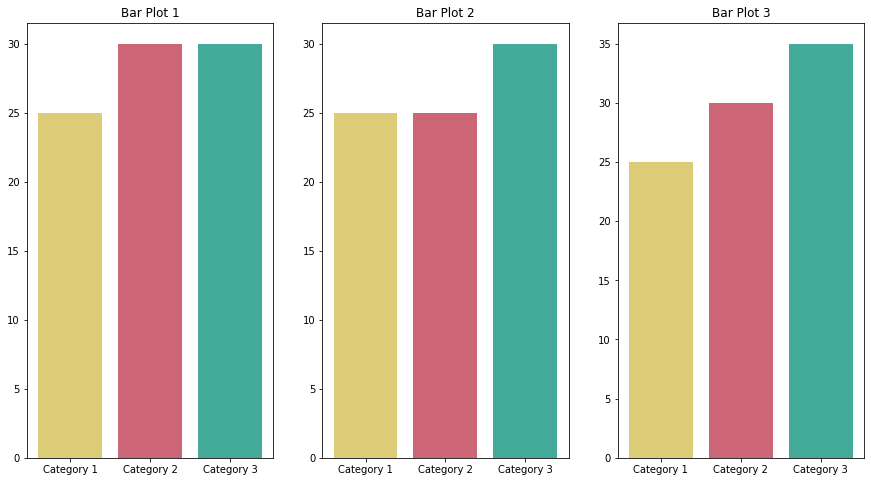
They allow the viewer to quickly compare the bars' sizes, which was impossible before with Pie Plots.
You can reproduce the bar plots with the following code:
import matplotlib.pyplot as plt

fig, (ax1, ax2, ax3) = plt.subplots(1, 3, figsize=(15, 8))

ax1.bar(
    x=['Category 1', 'Category 2', 'Category 3'],
    height=[25, 30, 30],
    color=['#DDCC77', '#CC6677', '#44AA99']
)

ax2.bar(
    x=['Category 1', 'Category 2', 'Category 3'],
    height=[25, 25, 30],
    color=['#DDCC77', '#CC6677', '#44AA99']
)

ax3.bar(
    x=['Category 1', 'Category 2', 'Category 3'],
    height=[25, 30, 35],
    color=['#DDCC77', '#CC6677', '#44AA99']
)

ax1.set_title('Bar Plot 1')
ax2.set_title('Bar Plot 2')
ax3.set_title('Bar Plot 3')

plt.show()
Let’s face it. It is difficult to interpret Pie Plots!
When the segments are similar in size, it is almost impossible to determine which is the largest. When they are not similar, the best you can do is determine that one is larger than the other, but not by how much.
It’s worth mentioning that 3D Pie charts are even worse! They distort the information of a 2D Pie Plot, making segments visually incomparable.
I hope this article has helped you to understand why we need to be careful when reading Pie Plots and why we should avoid using them.
If you’re interested in reading other articles written by me. Check out my repo with all articles I’ve written so far, separated by categories.
Thanks for reading
3 Reasons You Should Avoid Pie Plots At All Costs was originally published in Towards AI on Medium, where people are continuing the conversation by highlighting and responding to this story.
Join thousands of data leaders on the AI newsletter. Join over 80,000 subscribers and keep up to date with the latest developments in AI. From research to projects and ideas. If you are building an AI startup, an AI-related product, or a service, we invite you to consider becoming a sponsor.
Published via Towards AI
Towards AI Academy
We Build Enterprise-Grade AI. We'll Teach You to Master It Too.
15 engineers. 100,000+ students. Towards AI Academy teaches what actually survives production.
Start free — no commitment:
→ 6-Day Agentic AI Engineering Email Guide — one practical lesson per day
→ Agents Architecture Cheatsheet — 3 years of architecture decisions in 6 pages
Our courses:
→ AI Engineering Certification — 90+ lessons from project selection to deployed product. The most comprehensive practical LLM course out there.
→ Agent Engineering Course — Hands on with production agent architectures, memory, routing, and eval frameworks — built from real enterprise engagements.
→ AI for Work — Understand, evaluate, and apply AI for complex work tasks.
Note: Article content contains the views of the contributing authors and not Towards AI.
Related posts
Recent Posts


