


 With Variation And Covariation")
Exploratory Data Analysis (EDA) With Variation And Covariation
Last Updated on August 12, 2020 by Editorial Team
Author(s): Madhav Mishra
Data Science
Hi folks, welcome back to this edition of my blog, thank you so much for your love and support, I hope you all are doing well. Today we will learn and explore Exploratory Data Analysis(EDA) used in the data science life cycle.
This blog will cover topics in and around, What is EDA, the iterative cycle used for EDA, statistical tools we use for doing EDA, essential terms, what kind of questions one should ask around when he or she is dealing with this EDA process & finally we will understand variation and covariation that helps us play around EDA process. So guys, with all your enthusiasm, let us gear up and get started.
What is EDA?
It is a process that shows you or rather helps you to explore your data using visualization and transformation methodologies in a systematic way. It provides a suggestion for generating Hypotheses regarding data observation.
Let us see what google search engine say’s us about, What is EDA?
Technopedia defines EDA as :
Exploratory data analysis (EDA) is a term for certain kinds of initial analysis and findings done with data sets, usually early on in an analytical process. Some experts describe it as “taking a peek” at the data to understand more about what it represents and how to apply it.
Source Link: https://bit.ly/2QVKfwl
Data Decision Groups Author Dino Fire defines EDA as :
An Exploratory Data Analysis, or EDA, is an exhaustive look at existing data from current and historical surveys conducted by a company.
Source Link:https://bit.ly/2QMDxZc
And finally, Wikipedia defines EDA as :
In statistics, exploratory data analysis (EDA) is an approach to analyzing data sets to summarize their main characteristics, often with visual methods. A statistical model can be used or not, but primarily EDA is for seeing what the data can tell us beyond the formal modeling or hypothesis testing task. Exploratory data analysis was promoted by John Tukey to encourage statisticians to explore the data, and possibly formulate hypotheses that could lead to new data collection and experiments. EDA is different from initial data analysis (IDA), which focuses more narrowly on checking assumptions required for model fitting and hypothesis testing, and handling missing values and making transformations of variables as needed.
Source Link: https://bit.ly/2QOZoPP

Moving ahead, EDA is a task that Statistical Learners or Data Scientist’s use as an iterative cycle. What do they do in this iterative cycle?
It all takes three steps to understand this cycle. First, we generate questions about the data. Second, search for answers by visualizing, transforming, and modeling your data. Finally, Use what you learn from the data and make new questions from them.
We all know that EDA is an important part of any data analysis. Wherein, we investigate the quality of data, and with this, we do a cleaning of the data. As cleaning is one part of the EDA, we should ask questions about whether your data meets your expectations?
The tools of EDA, the basic tools of EDA that are used commonly by everyone in the industry is Visualization, Transformation & Modeling on your data to get valuable insights for further exploration and understanding. The goal here is to develop an understanding of your data.
The Investigation guide in EDA helps us in the best way by asking questions that focus on a specific part of your dataset & helps you decide which graph, models, or transformation is required to be made with the data.
The point here is that what type of questions we should ask that gives us a clear picture. So, in this case, Two types of questions will always be useful for making discoveries with your data.
1. What type of variation occurs within my variables?
2. What type of Co-variation occurs between my variables?
Important terms:
Variable: it is the quantity, quality, or property that you can measure.
Value: State of a variable when you measure it. (Value may change from measurement to measurement).
Observation: It is assumed as a data point. It is a set of measurements made under similar conditions. It can contain several values & different variables.
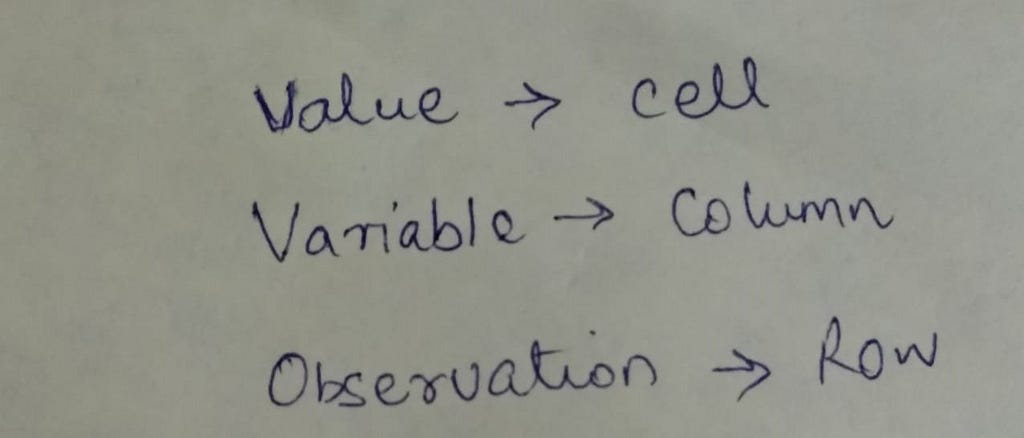
Tabular Data: It consists of a set of values. Here, the value goes in a cell, and Variable lies in a column & observation lie in the entire row.
Now let us understand about variation, it can be defined as the tendency of the value (cell) of a variable (column) to change from measurement to measurement. For example, we measure a continuous value twice. The resultant values we will get are two different values. In categorical variables also it can vary if you measure across different subjects. Say the eye color of two individuals may not be the same. It also helps us in understanding the unusual values(Outliers) in the data and also the missing values.
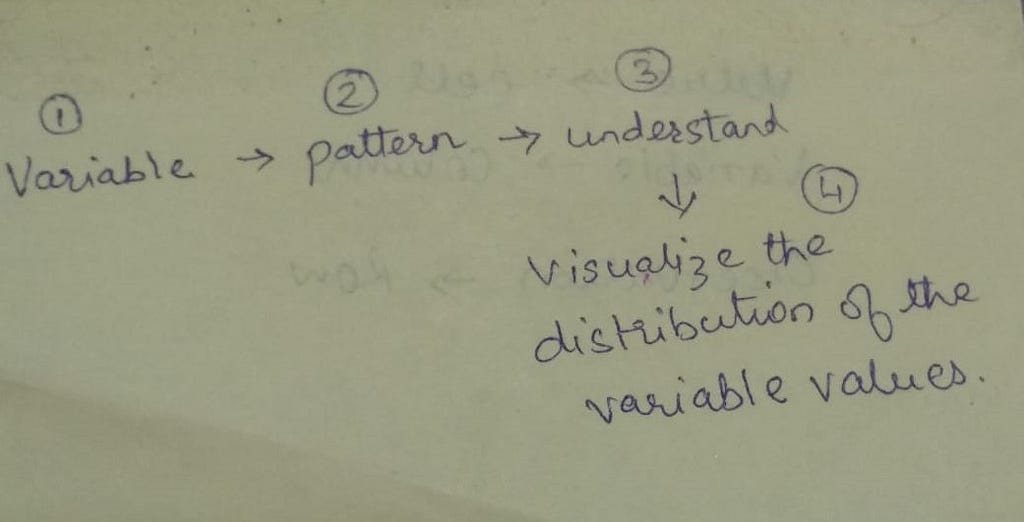
In short, what we do is, we take a variable we observe the pattern, we understand with those patterns, and finally, the best way is to visualize the distribution of the variable values.
Here let us make a note again:
Variation: describes the behavior within a variable.
Covariation: describes the behavior between variables.
So Co-variation is defined as a tendency for the value of two or more variables to vary together in a related way(relationship). The process here in covariation goes straight. We just visualize the relationship between two or more variables.
The basic tools used for visualization in EDA are Histogram, Box Plot, and Scatter Plot.
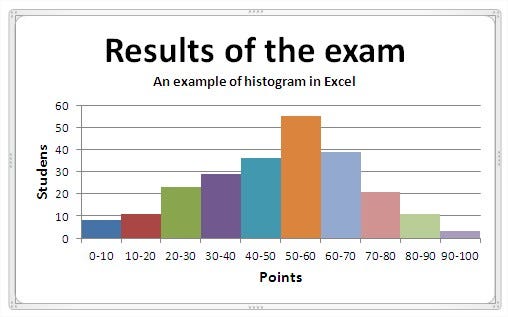
Histogram: A visualization method provides the distribution of numerical data. It is also an estimate of a probability distribution function (PDF).
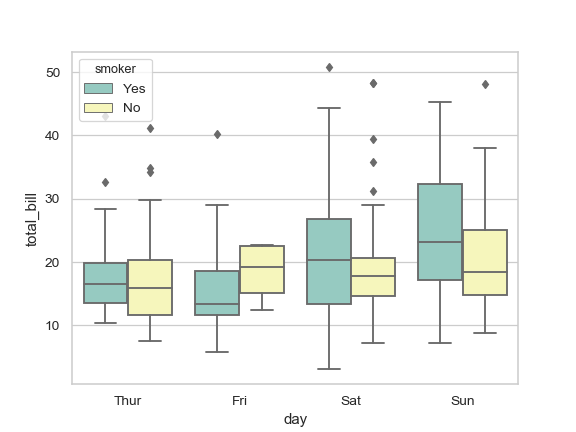
Box Plot: A Graphical method used to visualize groups of numerical data through their quartiles. It has lines extending vertically from the boxes indicating variability outside the upper (75%) and lower quartiles(25%) & also consist of outliers, if any in the data, these are called Whiskers, and hence they are called as box and whisker plot.
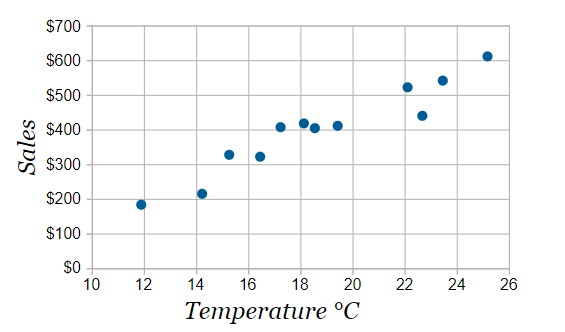
Scatter Plot: A visualization type of plot used to display values for two variables of data set. The data here is plotted as collection points(data point); every point represents the overall observation of a data point.
I hope the above collection of stuff is knowledgeable and would have given you a glance about the topic, and on this note, I would like to sign off for today. I would love to know if you wish me to cover any topic related to data science, Machine learning, etc., then please do leave your comments in the comment section on my blogs so that I can make a note of those blogs and write is for everyone’s learning.
Do follow me to get updates regarding all my blogs on Medium & LinkedIn. If you really like the article above, then please comment below because learning has no limits.
Stay Happy, Stay Fit, Stay Humble…!
Exploratory Data Analysis (EDA) With Variation And Covariation was originally published in Towards AI — Multidisciplinary Science Journal on Medium, where people are continuing the conversation by highlighting and responding to this story.
Published via Towards AI
Towards AI Academy
We Build Enterprise-Grade AI. We'll Teach You to Master It Too.
15 engineers. 100,000+ students. Towards AI Academy teaches what actually survives production.
Start free — no commitment:
→ 6-Day Agentic AI Engineering Email Guide — one practical lesson per day
→ Agents Architecture Cheatsheet — 3 years of architecture decisions in 6 pages
Our courses:
→ AI Engineering Certification — 90+ lessons from project selection to deployed product. The most comprehensive practical LLM course out there.
→ Agent Engineering Course — Hands on with production agent architectures, memory, routing, and eval frameworks — built from real enterprise engagements.
→ AI for Work — Understand, evaluate, and apply AI for complex work tasks.
Note: Article content contains the views of the contributing authors and not Towards AI.
Related posts


Recent Posts


")

