


Starbucks Capstone Project
Last Updated on September 1, 2020 by Editorial Team
Author(s): Vishal Siram
Data Analytics
Analysis of Starbucks Customer Data
Starbucks Capstone Challenge
Introduction
Starbucks has provided a dataset that emulates the behavior of customers using the Starbucks rewards mobile app. The Starbucks app provides a way to advertise and share offers with the customers. Customers can also use it to pay at the stores. Starbucks sends different types of advertisements and offers once every few days to its customers. A customer might get one of the following:
- Informational offer (i.e., mere advertisement)
- Discount offer
- Buy one get one free (BOGO) offer
Discount and BOGO offers have a challenge, that is, the customer must make a minimum purchase before it can redeem the offer. Additionally, each offer has an expiration date. In the case of the informational offers, the expiration date is when the customer stops feeling the influence of the advertisement.
The data provided includes the demographics of each customer, the app activity of customers for a period of 30 days. It includes the timestamps of when a customer received, viewed, and completed an offer when a purchase was done, and the amount of money spent.
Metrics
The metric I used this project is accuracy. Since we have a simple classification problem, I will use accuracy to evaluate my models. We want to see how well our model by seeing the number of correct predictions vs the total number of predictions. For the different models I used in this project, I checked the accuracy of my training and testing data sets and decided which to choose based on it.
Problem Statement
The goal of sending advertisements and offers to customers is to increase customer purchases. However, it would be naive to send all offers to all customers at the same time. The goal of the project is to take advantage of the transactions and demographics data to determine the offers that should be targeted to different groups of customers.
Datasets
The following data files have been provided and included in the project’s repo
- portfolio.json contains the details of each offer: duration, reward, type, etc
- profile.json contains demographic information of a customer
- transcript.json contains all customer's activity: transactions offers received, offers viewed, and offers completed.
The datasets were cleaned and merged in a way that each row includes customers' activity, customer's demographics, and offers metadata.
Data Analysis
Population
From the datasets, we first note that the simulated data was obtained for a period of 29.75 days, with 306,534 events. Each event represents a transaction, an offer received, an offer viewed, or an offer completed.
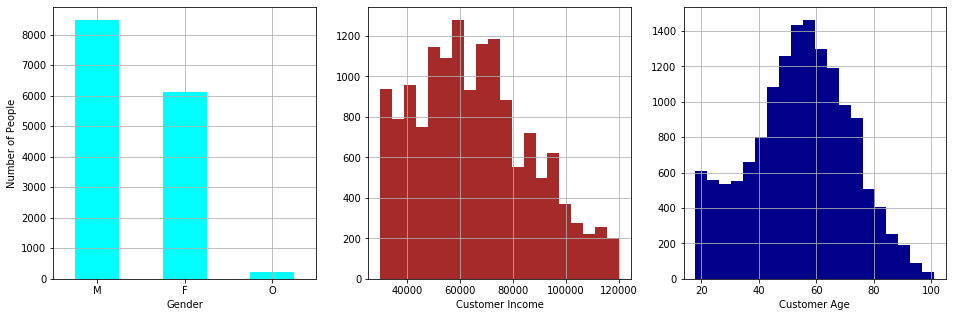
The figure shows the distribution of the population based on gender, income, and age. We note that around 8,500 customers are male, 6,100 are female and around 200 belong to another gender. In the case of the income, we observe that the curve roughly approaches a normal curve with a mean around 65,000 and a standard deviation of 21,000. Finally, the age also seems to approach a normal distribution. It is truncated on the left side of the curve due to the fact that a customer must be 18 years or older to be part of the Starbucks program. The mean of the age is 54 years and the standard deviation is 17.
Expense
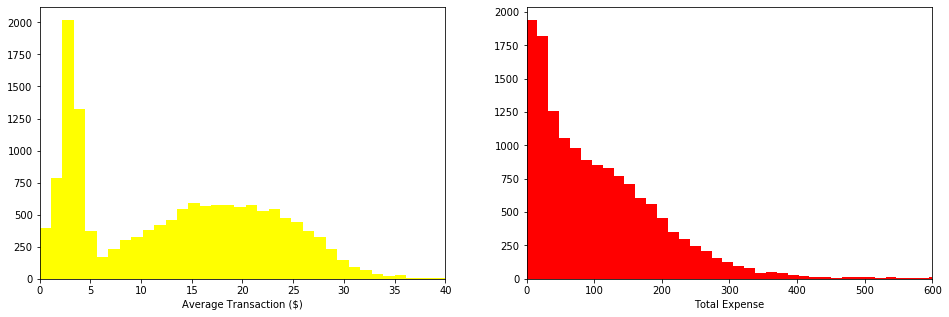
Now, we observe that the average expense of a single transaction follows a bimodal distribution. The first lobe is centered around $2.5 and the second one around $18. In the case of the distribution of the total expense done by a customer, the values seem to decrease exponentially.
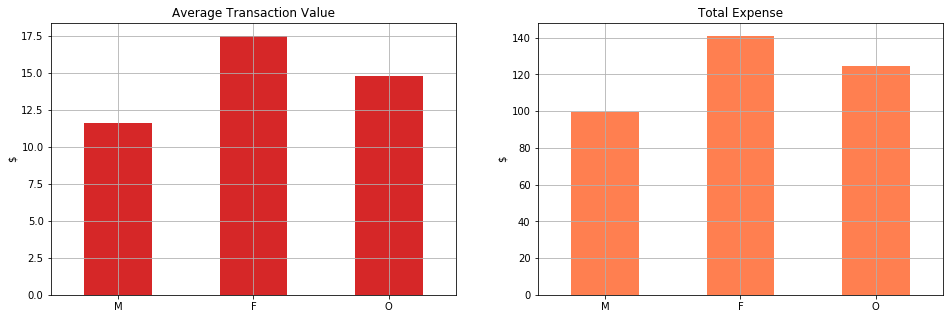
When separating the data based on gender, we note that the women make average purchases of $17.5, others of $15, and men of $12. However, we also note that the total amount of money spent by men and women is similar (~85,000) while others spend a fraction of that. This is distributions are directly affected by the number of members of each gender group.
Offers
Based on the data we have observed, we noticed that different customer groups have different spending habits, that might be influenced by the fact that they received an offer or not. For instance, the correlation coefficient of 0.52 suggests that there is a moderate correlation between the net expense (i.e., total expense – reward received) and whether a customer completed an offer or not. Similarly, the correlation with the completion of bogo and discount offers is 0.39 and 0.40, respectively. Finally, we observe a moderate correlation of 0.38 with the income of the customers.
These correlations indicate that offers should be targeted to customers based on their income or their transaction behavior. To take this into account, a knowledge-based recommendation system was implemented.
Simple System
Initially, we consider a simple system that recommends an offer that has been completed by a group of customers with the highest median of the net expense value. This system assumes a dependency between offer completion and net expense and aims at maximizing the net expense.
In order to use significant samples, we impose the following conditions:
- Customers with a positive net expense.
- Customers with at least 5 transactions completed.
- Only use customers that viewed and completed the offer.
The first condition is due to the fact that some customers received more rewards than the amount of money they spent. This is possible due to the fact that (a) a customer might have multiple offers active at the same time, and (b) a transaction might help multiple offers to reach their goal.
The second condition is necessary so we consider customers engaged with the offer/reward system. Finally, the third condition also targets considering customers engaged with the system. There are a few customers that completed offers without knowing that they received an offer.
A system with Demographics Consideration
As it is stated before, the net expense variable is also correlated to the income of the customers. So it would make sense to add some filtering to the recommendation system so that it benefits from this data and helps us target more specific users.
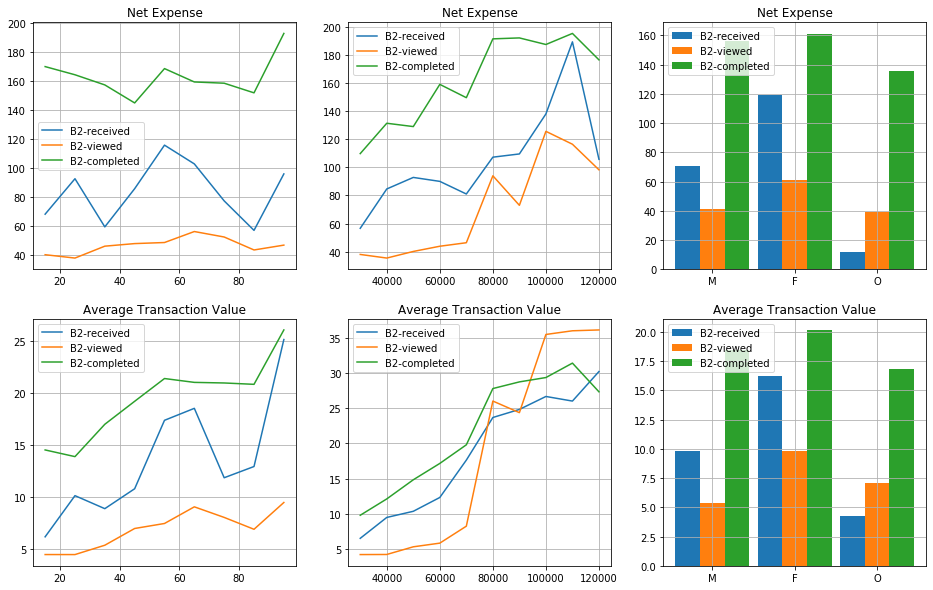
The figure shows the average expense of the customers that received, viewed, and completed the B2 offer. The received-offer plots consider the customers that received the offer but did not view it. The viewed-offer plots represent the customers that viewed the offer but did not complete it. Finally, the completed-offer plots are for the customers that view and completed the offer.
We note that customers that complete the offer spend significantly more than those that do not. However, for customers that make more than $80,000, the viewed-offer customers spend more on each transaction average than the ones that completed the offer. This might be an indication that a different offer might be a better fit for them.
To incorporate such information into our recommendation system, we add filters that help filter the dataset used in the offer ranking. The filters limit the population based on age, income, and gender. For instance, let’s consider two customers that make $95,000 and $100,000, respectively. As we discussed before, the population that makes more than $80,000 might have a different top offer recommended
Finally, in our population analysis, we noted that women make transactions of higher value when compared to men and other genders. Let’s see if that is reflected in our recommendation system.
> get_most_popular_offers_filtered(customers, n_top=10, gender='M')[0]
['B2', 'D1', 'B1', 'D4', 'B3', 'B4', 'D3', 'I1', 'D2', 'I2']
> get_most_popular_offers_filtered(customers, n_top=10, gender='M')[1]
{'B2': 138.835, 'D1': 136.89000000000001, 'B1': 136.45, 'D4': 126.485,
 'B3': 119.77000000000001, 'B4': 115.60999999999999, 'D3': 110.4,
 'I1': 109.575, 'D2': 101.88, 'I2': 71.00500000000001}
We note that for men, the offer recommended is the same as the one picked by the simple recommendation system. This might be due to the fact that the total customer population has men as a majority.
> get_most_popular_offers_filtered(customers, n_top=10, gender='F')[0]
['D1', 'D4', 'B1', 'D3', 'B2', 'B4', 'D2', 'I1', 'B3', 'I2']
> get_most_popular_offers_filtered(customers, n_top=10, gender='F')[1]
{'D1': 154.83, 'D4': 154.62, 'B1': 153.745, 'D3': 153.59000000000003,
 'B2': 150.37, 'B4': 145.21999999999997, 'D2': 145.03000000000003,
 'I1': 142.23, 'B3': 141.60999999999999, 'I2': 132.5}
In the case of females, the selection changes and it favors D1, which clearly has higher values of net expense and average transactions. Moreover, when compared with the selection of the simple system, there is a difference of $3.5 in the median net expense.
> get_most_popular_offers_filtered(customers, n_top=10, gender='O')[0]
['B3', 'D4', 'B1', 'D3', 'D1', 'D2', 'B2', 'I1', 'B4', 'I2']
> get_most_popular_offers_filtered(customers, n_top=10, gender='O')[1]
{'B3': 162.78000000000003, 'D4': 162.78000000000003, 'B1': 160.93,
 'D3': 160.42000000000002, 'D1': 143.25, 'D2': 142.73999999999998,
 'B2': 138.84, 'I1': 129.65499999999997, 'B4': 122.44, 'I2':
 88.63000000000001}
Formal evaluation
In order to formally evaluate these methods, we should pick a control and test groups with real users. The two recommendation systems can be used together. That is, the simple systems should be used for customers that do not provide their personal information, while the one with filters can be used for customers that do.
In this experiment, the control group would be subject to a random distribution of offers in which each user has the same odds of receiving the offer. This distribution mimics the same used to generate the simulated data provided for this analysis. The control group would use the two recommendation systems provided in this project.
For evaluation metrics, we can measure user engagement by keeping track of the ratio between received offers and viewed-and-completed offers. Also, it would be important to keep track of values that reflect the customer purchase habits such as the net expense, the total number of transactions, and the average transaction value. If these recommendation systems are successful we should see a significant improvement in customer/offer engagement as well as an increase in the purchase behavior of the customer.
Conclusions
This project provided a way to implement a real recommendation system from scratch. The process was engaging since it required the implementation of all the steps of the data science methodology. It was interesting as well as difficult to decide what kind of data to use for the analysis. The project could have taken different directions if other aspects of the data were taken into account. For instance, instead of using the net expense and the average transaction value, we could have used the frequency at which offers were completed, or what was the time that customer took to complete an offer after viewing it. This was possible thanks to the timestamps provided in the datasets.
Also, other recommendation systems could have been explored. Modeling the data could have been another choice to recommend offers. This was not picked since the simulated data made a lot of simplifications in comparison to the real app. The mathematical model would have needed considerable adjustments in order to be used in production systems. Picking metrics and methods than can be used in both the simulated system and the production system was considered in the design.
To improve the recommendation system, we could include other metrics. For instance, the frequency at which offers are completed would add an interesting dimension to the system. Also, our system does not take into account the number of valid offers a customer has given time. As we noted in our analysis, some customers took advantage of this to maximize the reward received at the least possible expense. To prevent this from happening, the company could limit the number of offers a customer receives, or if the customer has multiple offers, a purchase only helps the completion of a single offer.
Improvements
I think I got to a point where we have good results and we understand the data we have very well. But to make our results even better, I would try to improve my data collection and fix issues I have with NaN values. I will also try to get even more data like location and when the transaction was completed, which branch, and what time of the day. All these data can help us know when and where to give our offers. Also having more data is always a good thing to help us improve our model results.
To see a more detailed analysis with numbers and codes, check the project’s Github repository.
Starbucks Capstone Project was originally published in Towards AI — Multidisciplinary Science Journal on Medium, where people are continuing the conversation by highlighting and responding to this story.
Published via Towards AI
Towards AI Academy
We Build Enterprise-Grade AI. We'll Teach You to Master It Too.
15 engineers. 100,000+ students. Towards AI Academy teaches what actually survives production.
Start free — no commitment:
→ 6-Day Agentic AI Engineering Email Guide — one practical lesson per day
→ Agents Architecture Cheatsheet — 3 years of architecture decisions in 6 pages
Our courses:
→ AI Engineering Certification — 90+ lessons from project selection to deployed product. The most comprehensive practical LLM course out there.
→ Agent Engineering Course — Hands on with production agent architectures, memory, routing, and eval frameworks — built from real enterprise engagements.
→ AI for Work — Understand, evaluate, and apply AI for complex work tasks.
Note: Article content contains the views of the contributing authors and not Towards AI.
Related posts
")


Recent Posts


")


