


Quick and Easy Application of Network Graph Analysis: Measure Connectivity Between Countries by Air Traffic
Last Updated on June 3, 2024 by Editorial Team
Author(s): Greg Postalian-Yrausquin
Originally published on Towards AI.
I use the Networkx package to analyze a set of air routes between a group of countries and describe how they are connected.
Networkx is documented in the following publication:
Aric A. Hagberg, Daniel A. Schult, and Pieter J. Swart, “Exploring network structure, dynamics, and function using NetworkX”, in Proceedings of the 7th Python in Science Conference (SciPy2008), Gäel Varoquaux, Travis Vaught, and Jarrod Millman (Eds), (Pasadena, CA USA), pp. 11–15, Aug 2008
The dataset I used in the case was imported from Kaggle
import numpy as np
import pandas as pd
import matplotlib.pyplot as plt
import networkx as nx
import math

airports = pd.read_csv('airports.csv')
routes = pd.read_csv('routes.csv')

airports[['IATA','Country']]
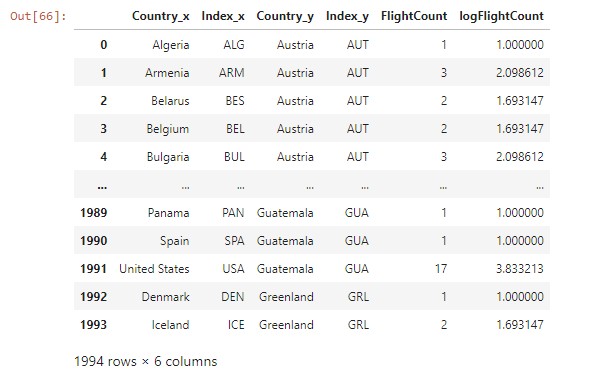
In the next couple of steps, I build the network graph object structure using a “guide” I made for country names.
DF = pd.merge(routes[['Source Airport','Destination Airport']],airports[['IATA','Country']],left_on='Source Airport',right_on='IATA')
DF = pd.merge(DF,airports[['IATA','Country']],left_on='Destination Airport',right_on='IATA')
DF = DF[DF['Country_x']!=DF['Country_y']]
DF = DF.groupby(['Country_x','Country_y']).count()
DF['FlightCount'] = DF.max(axis=1)
DF = DF.reset_index(drop=False)

#flight count between countries
DF = DF[['Country_x','Country_y','FlightCount']]

#apply indexes and log of the flight count as weight
key = pd.read_csv('key.csv')
DF = pd.merge(DF,key,left_on='Country_x',right_on='CountryName')
DF = pd.merge(DF,key,left_on='Country_y',right_on='CountryName')
DF = DF[['Country_x','Index_x','Country_y','Index_y','FlightCount']]
DF['logFlightCount'] = DF['FlightCount'].apply(lambda x: math.log(x) + 1)
DF
Here I do a first drawing of the network graph, using the intensity of the color for the number of flights. The reason I resorted to the logarithm was that the data was unbalanced, causing the color scale to lose meaning.
graph = nx.from_pandas_edgelist(DF[['Index_x','Index_y','logFlightCount']], 'Index_x', 'Index_y', 'logFlightCount')
edges,weights = zip(*nx.get_edge_attributes(graph,'logFlightCount').items())
plt.figure(figsize=(50,30))
nx.draw_networkx(graph, pos=nx.spring_layout(graph,weight='logFlightCount'), with_labels=True, edge_color=weights, edge_cmap=plt.cm.autumn_r, font_size=25, node_size=1500, node_color='#c0d6e4')
plt.show()
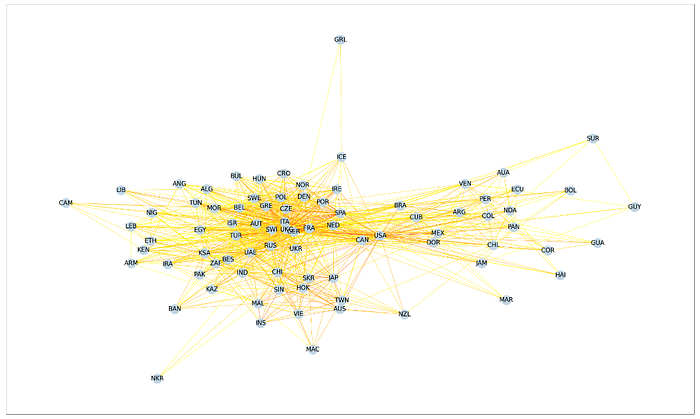
The k factor expresses how strong the gravity is between the nodes. A larger k means nodes are more separated, so less “structure” is seen in the graph.
plt.figure(figsize=(50,30))
nx.draw_networkx(graph, pos=nx.spring_layout(graph, k=1.5,weight='logFlightCount'), with_labels=True, edge_color=weights, edge_cmap=plt.cm.autumn_r, font_size=25, node_size=1500, node_color='#c0d6e4')
plt.show()
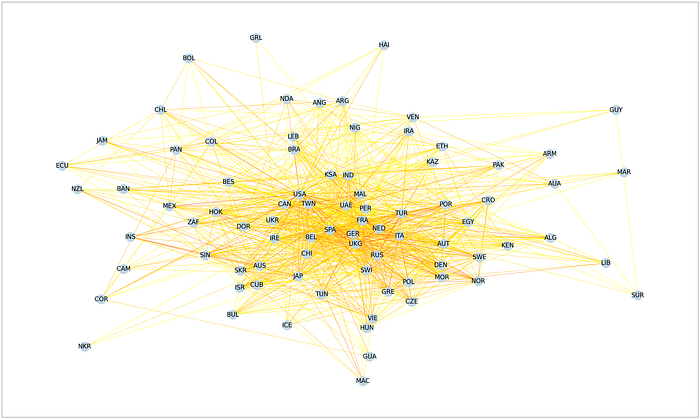
In this graph we can clearly see a structure starts to show, logically based around geography. Let’s continue with different values of k
plt.figure(figsize=(50,30))
nx.draw_networkx(graph, pos=nx.spring_layout(graph, k=0.01,weight='logFlightCount'), with_labels=True, edge_color=weights, edge_cmap=plt.cm.autumn_r, font_size=25, node_size=1500, node_color='#c0d6e4')
plt.show()
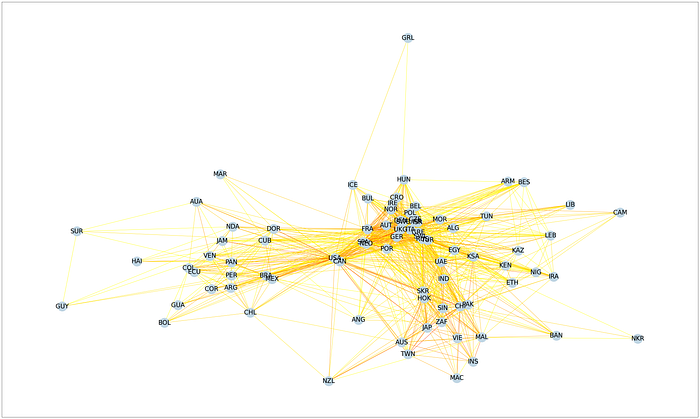
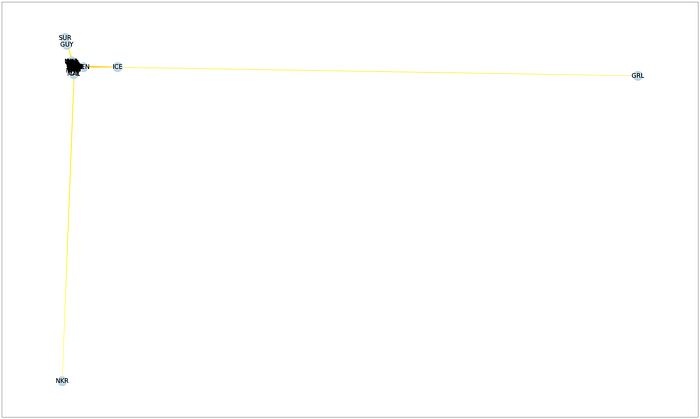
This other type of graph uses spectral decomposition (a dimension reduction process that has some parallels to PCA) to produce a representation of the graph.
This process is very useful to identify regions that are outliers from the rest. We see that Greenland and North Korea, are countries that are disconnected from the world; the same is true of Guyana and Surinam, but to a lesser extent.
plt.figure(figsize=(50,30))
nx.draw_networkx(graph, pos=nx.spectral_layout(graph, scale=10, dim=2,weight='logFlightCount'), with_labels=True, edge_color=weights, edge_cmap=plt.cm.autumn_r, font_size=25, node_size=1500, node_color='#c0d6e4')
plt.show()
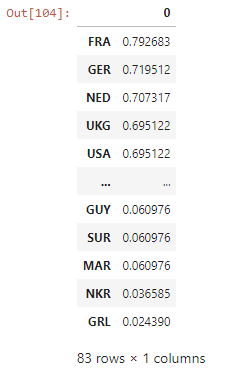
An interesting measure is the degree of centrality of the nodes (countries). Basically, three European countries that we know have large airports are the best connected to the world: France, Germany, and the Netherlands.
deg_cent = nx.degree_centrality(graph)
cent_array = np.fromiter(deg_cent.values(), float)
pd.DataFrame(pd.Series(deg_cent) ).sort_values(0, ascending=False)
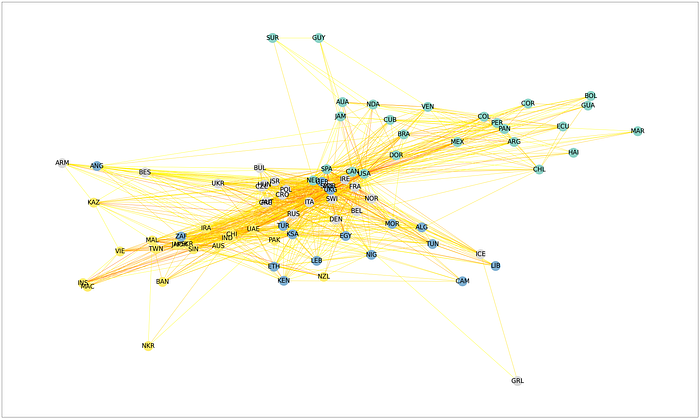
The last part is finding communities in the graph. The Louvain algorithm (https://en.wikipedia.org/wiki/Louvain_method) is useful in this case to correctly identify clusters that correlate to the continents of the countries, with some exceptions that can be explained by looking at the flight routes.
import community.community_louvain as community_louvain
part = community_louvain.best_partition(graph)
values = [part.get(node) for node in graph.nodes()]
plt.figure(figsize=(50,30))
nx.draw_networkx(graph, pos=nx.spring_layout(graph, k=0.01,weight='logFlightCount'), cmap = plt.get_cmap('Set3'), node_color = values, with_labels=True, edge_color=weights, edge_cmap=plt.cm.autumn_r, font_size=25, node_size=1500)
plt.show()
Join thousands of data leaders on the AI newsletter. Join over 80,000 subscribers and keep up to date with the latest developments in AI. From research to projects and ideas. If you are building an AI startup, an AI-related product, or a service, we invite you to consider becoming a sponsor.
Published via Towards AI
Towards AI Academy
We Build Enterprise-Grade AI. We'll Teach You to Master It Too.
15 engineers. 100,000+ students. Towards AI Academy teaches what actually survives production.
Start free — no commitment:
→ 6-Day Agentic AI Engineering Email Guide — one practical lesson per day
→ Agents Architecture Cheatsheet — 3 years of architecture decisions in 6 pages
Our courses:
→ AI Engineering Certification — 90+ lessons from project selection to deployed product. The most comprehensive practical LLM course out there.
→ Agent Engineering Course — Hands on with production agent architectures, memory, routing, and eval frameworks — built from real enterprise engagements.
→ AI for Work — Understand, evaluate, and apply AI for complex work tasks.
Note: Article content contains the views of the contributing authors and not Towards AI.
Related posts
Recent Posts


")

