Understanding Social Networks
Last Updated on July 26, 2023 by Editorial Team
Author(s): Naveed Ahmed Janvekar
Originally published on Towards AI.
Data Analysis
Understanding Social Networks
A Social Network is formed when there are a set of connections between entities (such as people or organizations) and interactions (such as friendship, contracts) between them. In today’s world, there are many social networks that exist — a famous one being Facebook’s friend’s network. However, as long as we can establish connections between various entities, we can represent many things around us as a social network or a graph. Other examples of a social network can be customers writing reviews on a product – customers and products become nodes in a network and writing reviews on products become an edge. In this article, I will use social networks and graphs interchangeably.
Some basics of social networks before we get into the complexity
1. Nodes — These are entities within a graph such as people, products, organizations, servers
2. Edges — These are connections or relationships between nodes, such as two people writing reviews on the same product
3. Weight — The weight of an edge is the strength of a connection. For example: if two people are connected by 10 mutual friends then the weight is 10.
4. Uni-partite graph — A network consisting of only one type of node
5. Multi-partite graph — A network consisting of more than one type of node
6. Undirected graph — If there is no direction of the relationship between nodes, then the graph is said to be an undirected graph. For example, a relationship between 2 friends.
7. Directed graph — If there is a direction of the relationship between nodes, then the graph is said to be directed. For example, a communication network where one entity initiatives a conversation with another entity.
Why is it important to analyze a social network?
- Gives us a better understanding of how entities or individuals are connected
- Gives us certain measures on important entities/connections within a network
3. Find similar entities based on the types of connections
4. Move beyond individual perception and analyze individuals/entities based on their connections
Let’s dive into analyzing a Social Network Analysis using Python
In order to better understand how we can leverage a graph network to our advantage, I am going to run an analysis and generate various network features on an open-source dataset.
Data source: SNAP Dataset Facebook Gemsec https://snap.stanford.edu/data/gemsec-Facebook.html . This dataset represents blue verified Facebook page networks of different athletes. Nodes represent the pages of athletes and edges are mutual likes among them. In order to achieve anonymity nodes are indexed from 0.
Open-source packages for Social Network Analysis:
Two very popular packages that are available for analyzing social networks are:
NetworkX: NetworkX is a Python package for the creation, manipulation, and study of the structure, dynamics, and functions of complex networks. https://networkx.org/
Networkit: NetworKit is a growing open-source toolkit for large-scale network analysis. Its aim is to provide tools for the analysis of large networks in the size range from thousands to billions of edges. https://networkit.github.io/
To download these packages run the following commands in the terminal:
pip3 install networkit
pip3 install networkx
Below are steps that can be followed to recreate the analysis in Jupyter Notebook:
Step 1: Load dataset from SNAP repository into a Pandas DataFrame and create a graph object and printing statistics on the number of nodes and edges

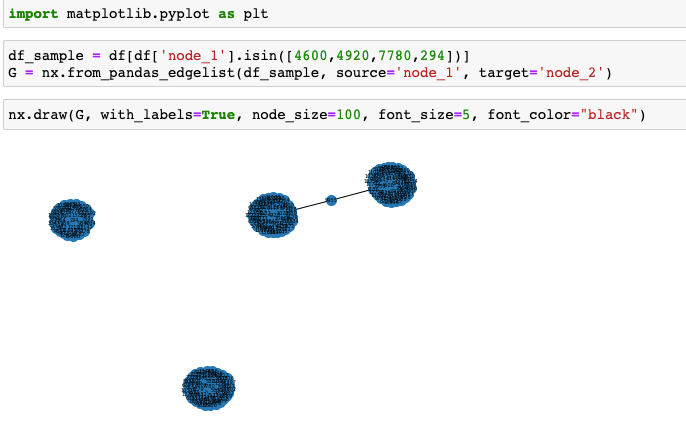
Step 2: Visualize the social network.
A particular challenge of a large social network is visualizing it on a screen. Hence, for the sake of this article, we will take a sample of the dataset by selecting a few nodes with a high number of connections.

Here we see that there are certain groups of nodes that are disjoint and some that are joined by a common node relationship.
Step 3: Generate Measures of Social Network
Degree Centrality — Degree Centrality is calculated at a node level and measures the number of edges it has. Degree centrality values are normalized by dividing by the maximum possible degree in a simple graph n-1 where n is the number of nodes in G.
Eigenvector Centrality — Degree Centrality is calculated at a node level and measures the influence a node has on its network.
Local Clustering Coefficient — The clustering Coefficient is a measure of the degree to which nodes in a graph tend to cluster together.


Conclusion
Using network analysis to understand the connections and entities in your ecosystem can greatly help you understand the behavior of entities, the influence of these entities within your ecosystem. These network graphs can further be divided into sub-graphs to drill down into user behavior. There are many other techniques such as generating embeddings from such graphs and feeding them as features to machine learning models or even clustering network embeddings to get meaningful insights.
Sources
https://snap.stanford.edu/data/gemsec-Facebook.html
https://networkx.org/documentation/stable/index.html
https://en.wikipedia.org/wiki/Social_network
Join thousands of data leaders on the AI newsletter. Join over 80,000 subscribers and keep up to date with the latest developments in AI. From research to projects and ideas. If you are building an AI startup, an AI-related product, or a service, we invite you to consider becoming a sponsor.
Published via Towards AI
Take our 90+ lesson From Beginner to Advanced LLM Developer Certification: From choosing a project to deploying a working product this is the most comprehensive and practical LLM course out there!
Towards AI has published Building LLMs for Production—our 470+ page guide to mastering LLMs with practical projects and expert insights!

Discover Your Dream AI Career at Towards AI Jobs
Towards AI has built a jobs board tailored specifically to Machine Learning and Data Science Jobs and Skills. Our software searches for live AI jobs each hour, labels and categorises them and makes them easily searchable. Explore over 40,000 live jobs today with Towards AI Jobs!
Note: Content contains the views of the contributing authors and not Towards AI.


