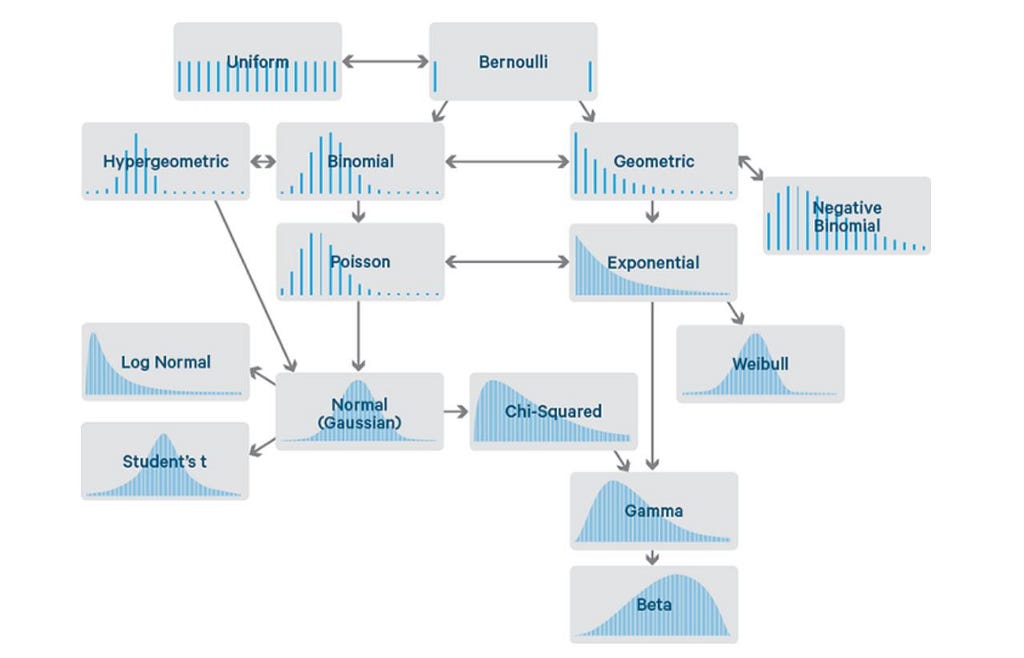
Different Probability Distributions Part 2
Last Updated on December 7, 2021 by Editorial Team
Author(s): Priyansh Tripathi
Originally published on Towards AI the World’s Leading AI and Technology News and Media Company. If you are building an AI-related product or service, we invite you to consider becoming an AI sponsor. At Towards AI, we help scale AI and technology startups. Let us help you unleash your technology to the masses.
Probability
Now we will see the Continuous variable distributions whereas in part 1 we saw the discrete distributions. In continuous distributions the point probability is equal to “0” and some of the probabilities over the entire range will be “1”. Different types of Continuous Distributions are:
1. Uniform Distribution
2. Normal Distribution
3. Exponential Distribution
4. Chi-squared Distribution
5. Gamma distribution
6. Student T-Distribution
7. F-Distribution
8. Log-Normal Distribution

Uniform Distribution
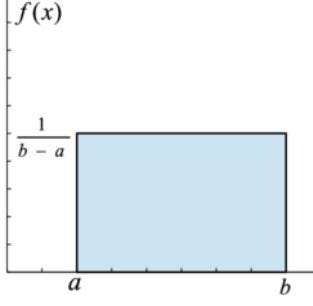
In a uniform distribution or rectangular distribution, data is uniformly distributed over a given interval where X takes a value between 2 specified values (a, b).
a<X<b or X€(a, b) where X~U(a, b)
PDF=f(x)=1/(b-a) when a<X<b or 0 otherwise.
The total area under the curve would be 1.
CDF=f(x)=x-a/(b-a) when a<X<b and 1 when x>=b
Mean=(b + a)/2
Variance=(b-a)²/12
Normal Distribution
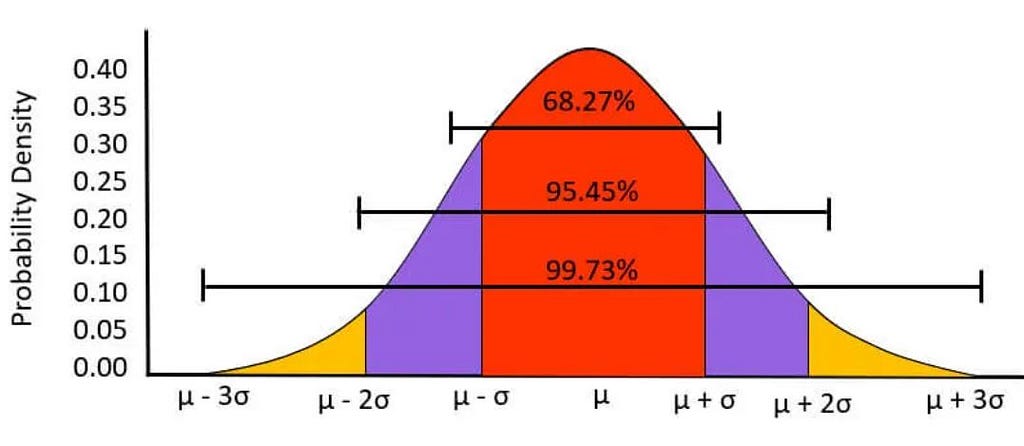
Here the data is distributed in a symmetrical manner or gaussian manner in a bell-shaped curve equally divided into 2 by mean. The total area under the curve is 1. The change in mean will change the graph to shift left or right. The graph ends never touches the baseline (asymptotes).
X~N(μ,σ²)

To solve the question we have to convert this distribution to a Standard Normal Distribution. It has all the properties of Normal Distribution, where μ is 0 and σ² is 1.
Here ƶ is a standard normal variant which is equal to (x-μ)/σ.
ƶ ~ SND(0, 1)
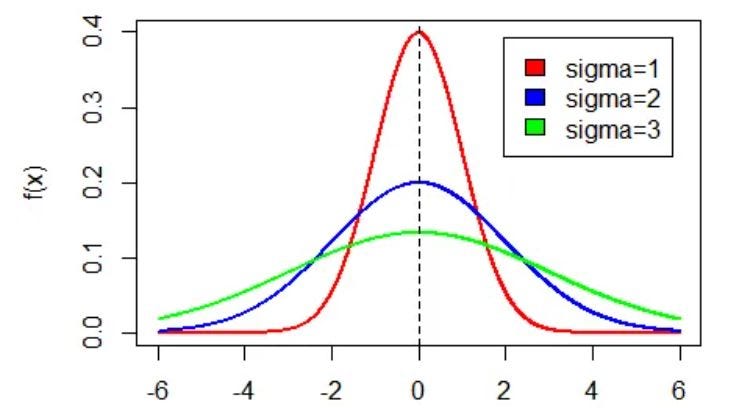
Whenever we change the σ the graph will become wider or thinner. We will calculate the z-score which means how far we are from the mean and we will get the probability value from the z-score table.
Exponential Distribution
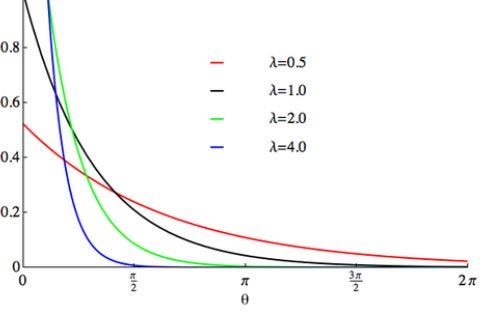
The exponential distribution is used to model the time until some specific independent event occurs at a constant average rate.
X is the waiting time or time taken by the event to occur.
X~E(λ)
λ is the rate at which events occur.


Chi-squared Distribution
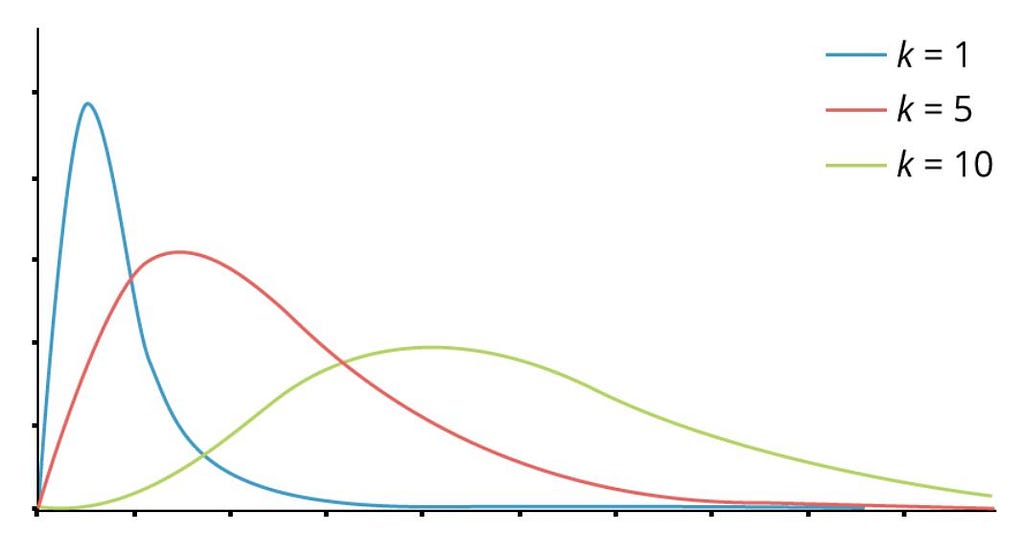
When we square the standard normal variant we will get the 𝞦². It is widely used in hypothesis testing and in finding confidence intervals which we will see in further articles. Here we have degrees of freedom which is “k” we can find it by subtracting 1 from the number of features available(n).
𝞦² €(0,∞) and 𝞦~N(μ,σ²). As we increase the k our graph will be more normalized.

For CDF we need to have the knowledge of Gamma Distribution because the Chi-squared Distribution is a special case of Gamma Distribution.

Mean=k
Variance=2k
Gamma distribution
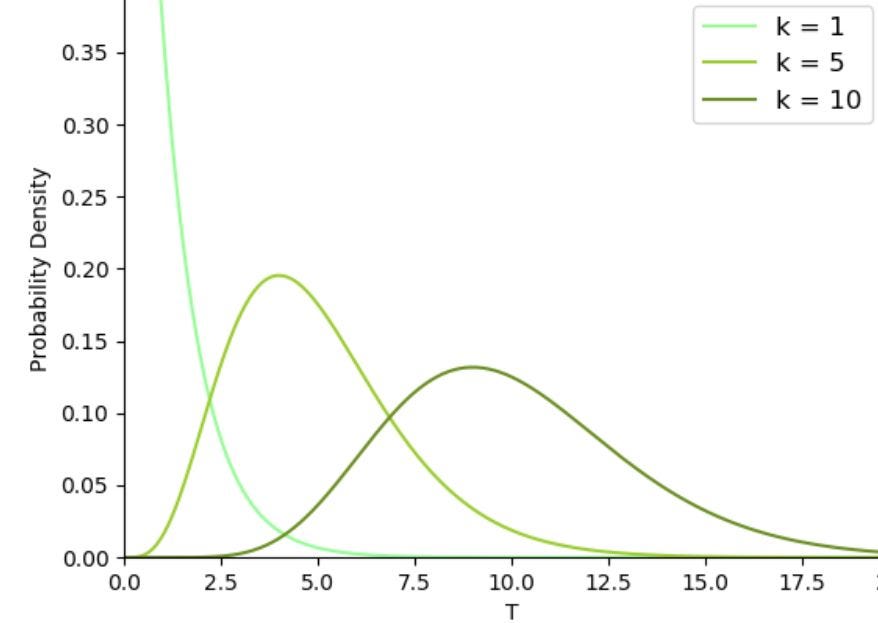
This Distribution is mostly used for modeling the waiting time until an event occurs. Gamma, Exponential, Poisson distribution is the same aspects of the Poisson process. Gamma function and Gamma Distribution are 2 different concepts.

Here we have 2 parameters a shape parameter α and a scale parameter β. When we divide 1 by β we will have a rate parameter.

Mean=αβ
Variance=αβ²
Student T-Distribution
A small sample is taken from the population(which is normally distributed) to get the estimates about the population and we also don’t know the standard deviation of the population. It is used in assessing the statistical significance, constructing confidence intervals, and in linear regression analysis.

Mean=0
Median=0
Mode=0
Variance=N/(N-2) where N>2 and N/(N-1) where N≥1.
F-Distribution
F-Distribution is frequently used in the analysis of variance.
Log-Normal Distribution
Whenever we have a skewed curve and to get a Gaussian curve we take its log so we get a normal curve then this distribution is called Log-Normal Distribution.


Conclusion
We have discussed both types of distribution from a data science perspective the knowledge about distribution one should have will be enough for the further topics after reading this article. Check the other articles too for better understanding.
Different Probability Distributions Part 2 was originally published in Towards AI on Medium, where people are continuing the conversation by highlighting and responding to this story.
Join thousands of data leaders on the AI newsletter. It’s free, we don’t spam, and we never share your email address. Keep up to date with the latest work in AI. From research to projects and ideas. If you are building an AI startup, an AI-related product, or a service, we invite you to consider becoming a sponsor.
Published via Towards AI
Take our 90+ lesson From Beginner to Advanced LLM Developer Certification: From choosing a project to deploying a working product this is the most comprehensive and practical LLM course out there!
Towards AI has published Building LLMs for Production—our 470+ page guide to mastering LLMs with practical projects and expert insights!

Discover Your Dream AI Career at Towards AI Jobs
Towards AI has built a jobs board tailored specifically to Machine Learning and Data Science Jobs and Skills. Our software searches for live AI jobs each hour, labels and categorises them and makes them easily searchable. Explore over 40,000 live jobs today with Towards AI Jobs!
Note: Content contains the views of the contributing authors and not Towards AI.


Comments are closed.