


Things to watch out for while working with the MTA turnstile data in 2022
Last Updated on February 7, 2022 by Editorial Team
Author(s): Serdar
Originally published on Towards AI the World’s Leading AI and Technology News and Media Company. If you are building an AI-related product or service, we invite you to consider becoming an AI sponsor. At Towards AI, we help scale AI and technology startups. Let us help you unleash your technology to the masses.
Data Analysis
Whether you work with the New York Metropolitan Transportation Authority (MTA) data for professional or Bootcamp-related projects there are some things you need to be aware of. My motivation was to analyze this dataset as part of a project at the Istanbul Data Science Academy for exploratory data analysis (EDA) purposes. The data used in this project is from May 2021 to November 2021 consists of a total of 25 weeks and more than 5 million rows.
Data-related information is gathered from the MTA’s data dictionary and other open sources and summarized below.
About the Data
The Metropolitan Transportation Authority is North America’s largest transportation network, serving a population of 15.3 million people across a 5,000-square-mile travel area surrounding New York City through Long Island, southeastern New York State, and Connecticut.
The MTA network comprises the nation’s largest bus fleet and more subway and commuter rail cars than all other U.S. transit systems combined. The MTA’s operating agencies are MTA New York City Transit, MTA Bus, Long Island Rail Road, Metro-North Railroad, and MTA Bridges and Tunnels.
Turnstile data is derived from the physical device at a Control Area (Station) used to collect fares for entry into the system. The collected data is then transmitted to a mainframe application called the Automated Fare Collection System (AFC).
The audit register data is extracted from a central database weekly on Saturdays for posting. The actual register data is generated at the turnstile device every 4 hours at which time the device uploads the data to a central database.
The four-hour intervals will differ from other stations due to the need for staggering to prevent flooding the system with audit readings all at once. Systemwide, stations have been set to begin audit transmittal between 00 to 03 hours, then every 4 hours after the first audit of the day.
The data is broken down into Daily and Hourly periods. The data is 10 digits long and will roll over to zero(0) on over-flow. Other factors that may impact the data are:
- Hardware failure where the hard drive needs to be replaced and initialized.
- Data corruption from faulty devices, or heavy banging on the turnstile.
DESC represents the “REGULAR” scheduled audit event (Normally occurs every 4 hours)
- Audits may occur more frequently than 4 hours due to planning, or troubleshooting activities.
- Additionally, there may be a “RECOVR AUD” entry: This refers to a missed audit that was recovered. If a recovered audit is sent and is identical to the previous register reading, it will be omitted.
ENTRIES and EXITS are the cumulative values for a device. This register was initialized during the system setup. It is a 10 digit number representing the number of values on the specific device since its inception. Other forms of initialization may occur upon roll-over of the counter, erasing the memory device containing the register data, and replacing the processing device of the turnstile.
Exploratory Data Analysis (EDA)
Data Columns:
Index(['C/A', 'UNIT', 'SCP', 'STATION', 'LINENAME', 'DIVISION', 'DATE', 'TIME',
       'DESC', 'ENTRIES', 'EXITS'],
      dtype='object')
A total number of rows and columns:
df_copy.shape
(5242282, 11)
No null values:
df_copy.isnull().sum()
C/A          0
UNIT         0
SCP          0
STATION      0
LINENAME     0
DIVISION     0
DATE         0
TIME         0
DESC         0
ENTRIES      0
EXITS        0
TURNSTILE    0
dtype: int64
Zero duplicate values:
df_copy.duplicated().sum()
0
There are 379 subway stations:
len(df_copy["STATION"].unique())
379
If you sort the values by the turnstile and datetime values from smallest value to biggest before creating the 4_Hour_Entries, 4_Hour_Exits, and Foot_Traffic columns
df.sort_values([‘TURNSTILE’,’Datetime’], ascending= (True,True) , inplace=True)
And we use the shift() method to calculate the values between the gradual rows
FOUR_HOUR_ENTRIES = df.ENTRIES - df.ENTRIES.shift(1)
df['FOUR_HOUR_ENTRIES'] = FOUR_HOUR_ENTRIES.fillna(0)
FOUR_HOUR_EXITS = df.EXITS - df.EXITS.shift(1)
df['FOUR_HOUR_EXITS'] = FOUR_HOUR_EXITS.fillna(0)
Despite the fact that we have sorted the values we still get large positive and negative numbers:
df_copy.FOUR_HOUR_ENTRIES.max()
2146993563.0
df_copy.FOUR_HOUR_ENTRIES.min()
-2144271150.0
df_copy.FOUR_HOUR_EXITS.max()
2133740922.0
df_copy.FOUR_HOUR_EXITS.min()
-2133740909.0
When we dig deeper into the dataset we find out that the entry and exit values the day are a lot bigger than on the following day.
df_copy[df_copy['FOOT_TRAFFIC'] == df_copy['FOOT_TRAFFIC'].min()]
df_copy[df_copy.index ==2472558 ]
For the ‘47–50 STS-ROCK’ specific investigation we get irregular time entries can be seen. So the 4-Hour observation is not the same for all turnstiles.
st = '47-50 STS ROCK'
dfx = df_copy[df_copy['STATION']==st].reset_index(drop=True).iloc[10:,:]
dfx.plot("Datetime", "FOOT_TRAFFIC")
dfx.tail(20)

If you look at the data closer(in the below screenshot), you see that there are even minutes displayed with it which should not be the case. That also makes the grouping really hard since the data collection timeframe is 4 hours. By minute entries just make it worse..
Another thing I would like to touch upon here is that if we don’t set a limit for the 4_hour_entries and 4_hour_exits columns to a certain entrance level, as it can be seen from the below screenshot numbers go off the roof.
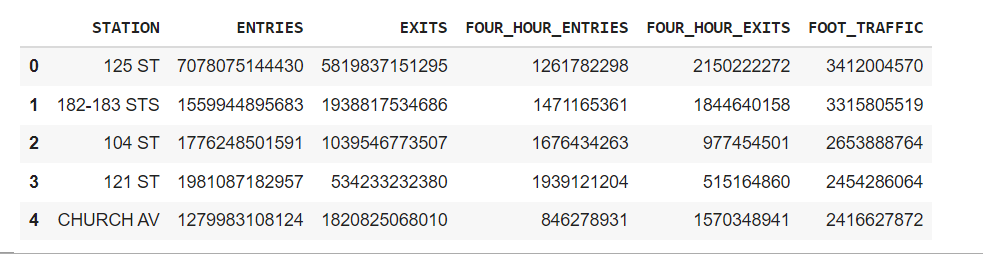
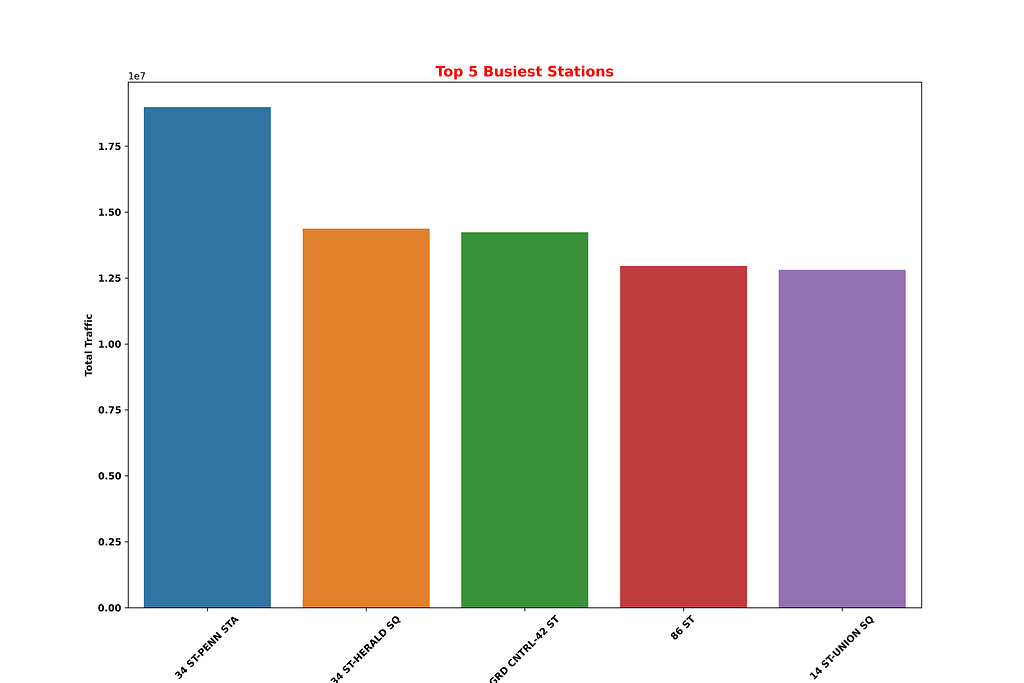
#Summing up traffic by station
station_totals = df_copy.groupby('STATION').sum().sort_values('FOOT_TRAFFIC', ascending=False).head(5)
station_totals.sort_values(by='FOOT_TRAFFIC', ascending=False, inplace=True)
station_totals.reset_index(inplace=True)
station_totals['FOUR_HOUR_ENTRIES'] = station_totals['FOUR_HOUR_ENTRIES'].astype('int64')
station_totals['FOUR_HOUR_EXITS'] = station_totals['FOUR_HOUR_EXITS'].astype('int64')
station_totals['FOOT_TRAFFIC'] = station_totals['FOOT_TRAFFIC'].astype('int64')
top_5 = station_totals.head(5)
top_5
Here I have borrowed this approach from Chris Whong and apparently, he also got it from someone else. But you can read more about his approach to this here. What it does is that excludes values bigger than 10000 and smaller than 0 in consideration of from a turnstile no more than 10000 people cannot pass during the audit time frame.
df_copy['FOUR_HOUR_ENTRIES'] = df_copy.groupby(['TURNSTILE']).FOUR_HOUR_ENTRIES.transform(lambda x: np.where((x<0)|(x>10000),x.mask((x<0)|(x>10000)).mean(),x))
df_copy['FOUR_HOUR_EXITS'] = df_copy.groupby(['TURNSTILE']).FOUR_HOUR_EXITS.transform(lambda x: np.where((x<0)|(x>10000),x.mask((x<0)|(x>10000)).mean(),x))
Hope this article was successful enough to address some of the challenges you may face when it comes to understanding the data. I know for the fact that there is not one approach amongst open source projects. Please feel free to share any feedback or comments you may have on the data or the article. I am hoping to get back to the project and improve it if possible.
Things to watch out for while working with the MTA turnstile data in 2022 was originally published in Towards AI on Medium, where people are continuing the conversation by highlighting and responding to this story.
Join thousands of data leaders on the AI newsletter. It’s free, we don’t spam, and we never share your email address. Keep up to date with the latest work in AI. From research to projects and ideas. If you are building an AI startup, an AI-related product, or a service, we invite you to consider becoming a sponsor.
Published via Towards AI
Towards AI Academy
We Build Enterprise-Grade AI. We'll Teach You to Master It Too.
15 engineers. 100,000+ students. Towards AI Academy teaches what actually survives production.
Start free — no commitment:
→ 6-Day Agentic AI Engineering Email Guide — one practical lesson per day
→ Agents Architecture Cheatsheet — 3 years of architecture decisions in 6 pages
Our courses:
→ AI Engineering Certification — 90+ lessons from project selection to deployed product. The most comprehensive practical LLM course out there.
→ Agent Engineering Course — Hands on with production agent architectures, memory, routing, and eval frameworks — built from real enterprise engagements.
→ AI for Work — Understand, evaluate, and apply AI for complex work tasks.
Note: Article content contains the views of the contributing authors and not Towards AI.
Related posts
Recent Posts


")

