Shapash 2.3.0: Enhancing Webapp Built-In Features for Comprehensive Machine Learning Model Interpretation
Last Updated on July 17, 2023 by Editorial Team
Author(s): Maxime Lecardonnel
Originally published on Towards AI.
The interpretability of machine learning models is a constantly evolving research area that aims to make the decisions made by these algorithms understandable to humans. Shapash addresses these challenges by providing clear and precise explanations. It also focuses on its user-friendliness, making it accessible to everyone through its Webapp. In addition to helping the Data Scientist understand their model, Shapash Webapp is a useful tool for explaining models to a field expert with a non-technical background.
In order to improve its ergonomics, two new features were added to Shapash in the previous release to enable samples picking in the Webapp.

However, picking was limited to the data in the Webapp and thus to model variables. It could then become necessary to go back and forth with a notebook or a script to filter the data according to the characteristics of variables external to the model.
The latest release of Shapash (version 2.3.0) incorporates new features that enhance the use of filters on the study dataset. These features enable the integration of variables external to the model and the addition of target and prediction error variables to the dataset. Thanks to this feature, it is possible to create specific subsets of the dataset and studying their contributions can be crucial in understanding how the model works.
Shapash also brings an Identity Card feature that simplifies the process of reading the local data of a selected sample. It provides a consolidated summary of all the information that characterizes the sample. It makes text variables easier to read as it was challenging to do from the dataset.
Let’s explore the benefits of these new features with a use case from the public Kaggle dataset: US accidents (2016–2021) U+007C Kaggle. In our example, the dataset is processed to keep only a few variables and a sample of 50,000 rows evenly proportioned by year. We aim to predict the severity of an accident, high or low. Thus the accident severity variable is also reworked to match our binary classification problem.
But first, let’s remind ourselves how Shapash explains model results in this use case with its web application.
Explaining Model Results using Shapash Webapp
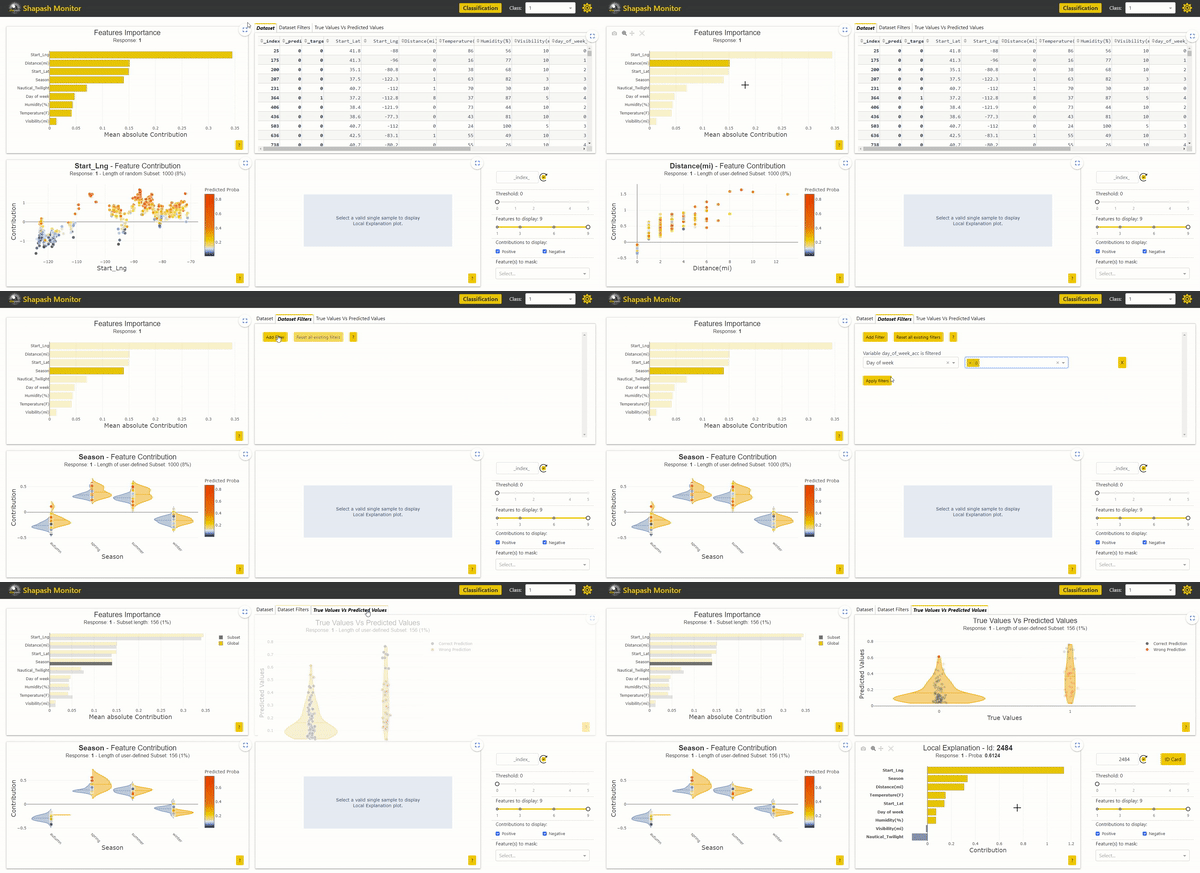
Shapash offers a user-friendly tool with its Webapp to understand machine learning models. In addition to the study dataset, the Webapp displays four plots to allow users to make a complete analysis of their models :
- The Features Importance plot orders the importance to determine which variables have the most impact on the model
- The Feature Contribution plot shows how a feature affects the prediction based on the contributions and the modalities of the feature samples.
- The True Values vs. Predicted Values plot displays the prediction errors to help understand the global model’s performance.
- The Local Explanation plot provides a view of a selected sample’s contributions to highlight the link between the prediction and specific feature modalities.
Additional Variables for In-Depth Understanding Model Behavior on Subsets and Samples
Adding variables external to the model enhances subset analysis with data selection filters. It becomes possible to take into account variables potentially related to the target, which are not part of the model by choice. This feature enables users to verify model behavior based on these variable modalities.
The additional data must be provided when executing the compile method of Shapash’s SmartExplainer:
For our use case, we want to predict the severity of the accident regardless of the year it occurred. We can then add the “year” variable to the additional data outside the model. We also add the “description” variable, which is textual data describing the accident. It is, therefore, unique or almost unique for each accident and should not be taken into account as such in the model. However, it can provide valuable information during the analysis.
In other use cases, it could be interesting to add variables not available at the time of prediction for a post-prediction analysis. A directly correlated variable to the target, like a cost variable here, could be interesting to investigate. It will allow seeing if an accident is at the limit of being attributed to a non-severe or severe accident.
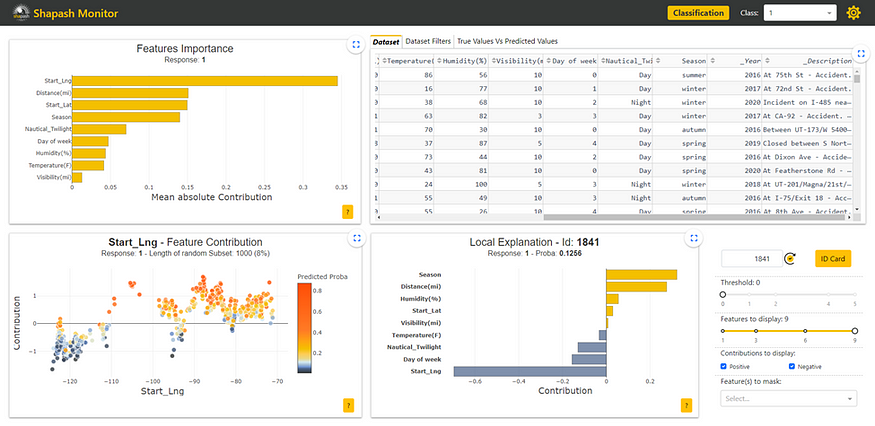
After launching the Webapp, we can see our two additional variables in the study dataset located in the upper right corner. They are written in italics with an underscore at the beginning:
It is now possible to use these variables to filter our data and study specific subsets. Here we filter on the year column to keep only the accidents that occurred in 2019:
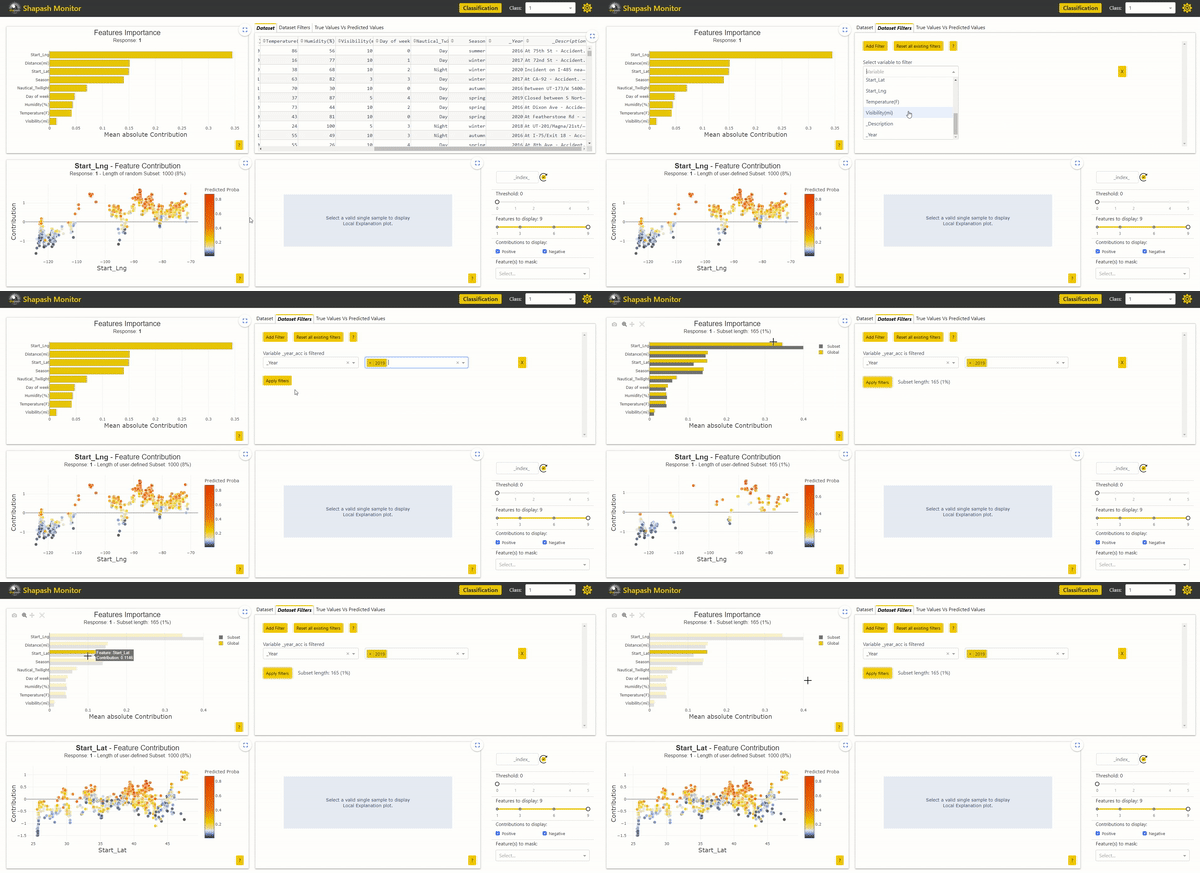
In the Features Importance graph in the top left corner, we can see that the contributions of the subset of accidents from 2019 are not identical to those of the total population. The most impactful variable, which is the starting longitude of the accident, is more important for accidents in 2019. We can observe differences in contributions between years. By further comparing using Eurybia, we can detect a significant data drift over the years. Therefore, it may be wise to train a model only on the most recent data to predict the severity of future accidents. In the future, it would then be necessary to update the model in case of significant data drift.
We now want to understand our prediction errors by looking more closely at our samples. The additional column “description” can therefore be useful in interpreting the different cases.
We start by selecting a sample whose predicted accident severity is low while it is actually severe. It is possible to select a sample with these characteristics from the True Values Vs. Predicted Values graph located in the top right corner by clicking on one of the points:

With this new version of Shapash, it would have also been possible to identify such a sample thanks to the addition of the target variable to the study dataset. Indeed, we could have used filters on both the prediction and target variables to obtain a subset of mispredicted samples.
The Identity Card Summarizing Sample Information
The Identity Card objective is to present in a very readable way all the information that characterizes a selected sample. It includes all the modalities for each variable, accompanied by the contributions associated with each of those exploited by the model.
With the Identity Card, we can analyze in more detail the characteristics of the sample we have selected:
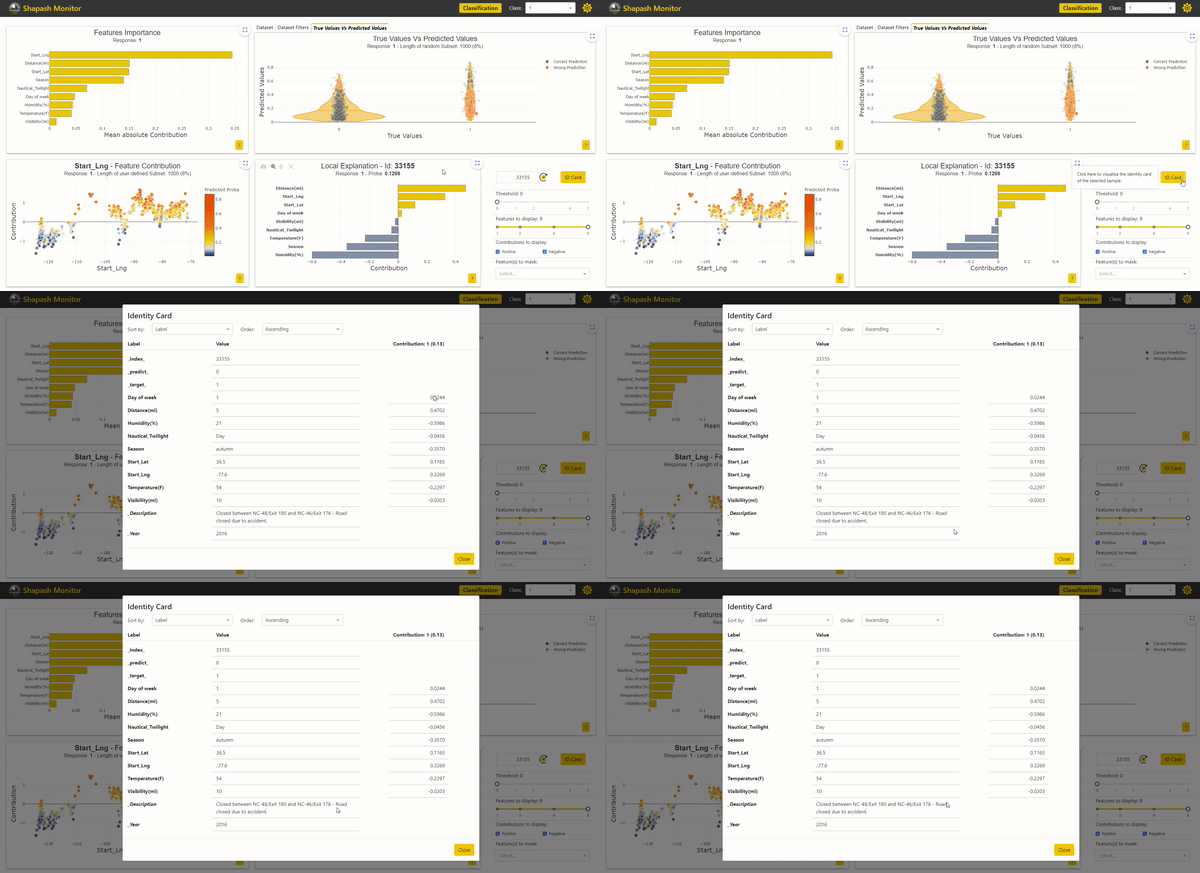
Thanks to the description data we added, we can read that the accident caused the road to be closed. This corroborates reality with the severity of the accident. It is, therefore, conceivable to improve our model by adding new learning variables.
Conclusion
With its new built-in features, Shapash Webapp continues to be improved to enable a fully integrated understanding of models that ultimately leads to their improvement. The new Shapash 2.3.0 release enhances the samples selection features introduced in the previous Shapash 2.2.0 release. The new advanced filtering options with additional variables and the Identity Card feature allow a facilitated In-Depth analysis of the models.
Stay ahead of the curve by adopting Shapash 2.3.0 and harnessing the power of advanced machine learning model interpretation to make better data-driven decisions.
If you have any needs to express, feel free to join Shapash community on GitHub by submitting your issues and contributing to the project.
Join thousands of data leaders on the AI newsletter. Join over 80,000 subscribers and keep up to date with the latest developments in AI. From research to projects and ideas. If you are building an AI startup, an AI-related product, or a service, we invite you to consider becoming a sponsor.
Published via Towards AI
Take our 90+ lesson From Beginner to Advanced LLM Developer Certification: From choosing a project to deploying a working product this is the most comprehensive and practical LLM course out there!
Towards AI has published Building LLMs for Production—our 470+ page guide to mastering LLMs with practical projects and expert insights!

Discover Your Dream AI Career at Towards AI Jobs
Towards AI has built a jobs board tailored specifically to Machine Learning and Data Science Jobs and Skills. Our software searches for live AI jobs each hour, labels and categorises them and makes them easily searchable. Explore over 40,000 live jobs today with Towards AI Jobs!
Note: Content contains the views of the contributing authors and not Towards AI.


