How does Support Vector Machine work for Regression problems?
Last Updated on July 26, 2023 by Editorial Team
Author(s): Akash Dawari
Originally published on Towards AI.
All About Support Vector Machine
This article will explore Support Vector Machine and try to answer the following question:
- What is a Support Vector Machine?
- What are the terminologies used in Support Vector Machine?
- How does Support Vector Machine work for classification problems?
- How does Support Vector Machine work for Regression problems?
- What are the advantages and disadvantages of a Support Vector Machine?
- How to implement Support Vector Machine using Scikit-learn?
What is a Support Vector Machine?
Support Vector Machine is a supervised machine learning algorithm. This algorithm is widely used in data science/machine learning problems as this algorithm is very powerful and versatile. Support Vector Machine can be used both in linear and non-linear classification, regression, and even outlier detection. Though it is heavily used in classification problems having complex small or medium-sized datasets. Support Vector Machine is a non-probabilistic linear classifier that uses the geometrical approach to distinguish the different classes in the dataset.
What are the terminologies used in Support Vector Machine?
As we understand what is support vector machine. Now we will deep dive into the core concepts and terminologies used in support vector machines.
Support Vectors
Vectors are the data points represented on the n-dimensional graph. For example, we represent a point on a 2D graph like this (x,y) and in a 3D graph like this (x,y,z) where x,y,z are the axis of the graph.

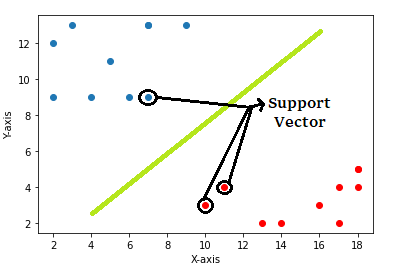
So, Support Vectors are the vectors on the n-dimensional graph which are the closest points to the hyperplanes and influence the orientation of the hyperplane. Through this support-vector, we pass the positive and negative margins for the hyperplane.
Hyperplane
A hyperplane is nothing but just a decision boundary with (n-1) dimensions where n is the number of columns in the dataset. Hyperplane separates points/vectors of different classes.
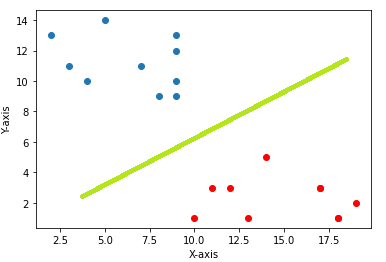
Example-1: In 2D graph representation we separate points using a line as shown below.

The green line represented in the picture is acting as the hyperplane and the equation of this hyperplane will be equal to the equation of the line that is

We can re-write this as

Example-2: In 3D graph representation we separate points using a plane as shown below.

The sheet represented in the picture is acting as the hyperplane and the equation of this hyperplane will be equal to the equation of the sheet that is

Similarly, for the n-dimensional dataset, the hyperplane equation will be:

If we re-write this in vector form:

Kernel
The kernel is a mathematical function used in SVM to transform non-linear data to a higher dimensional data set so that, SVM can separate the classes of the data by using a hyperplane. In Scikit-learn, SVM supports various types of the kernel like ‘linear’, ‘poly’, ‘rbf’, ‘sigmoid’. Also, we can create our own kernel and pass it in the scikit-learn SVM.
Now Let see an example to better understand the role of the kernel:
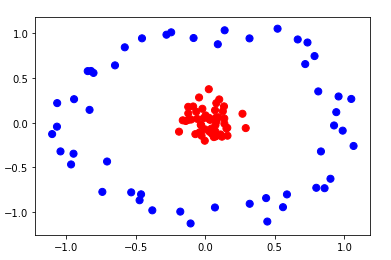
The below picture represents two types of data points.

Now if we want to create a hyperplane it would look like this.

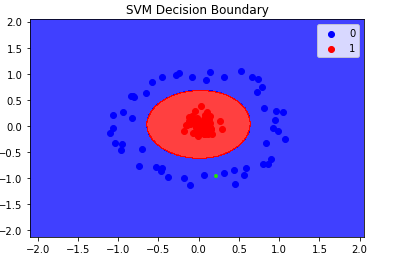
We can observe that it is not able to separate all the points correctly. But if we consider radial basis function kernel.

It is able to separate all the points correctly. But the question is How? Actually radial basis function kernel transforms the dataset like the below picture.

We can observe that in 3D we can draw a Hyperplane to separate the points. This is how with the help of correct kernel SVM classify the data points.
Margin
Margin is the line that passes through the support vectors and they are always parallel to the hyperplane.

How does Support Vector Machine work for Classification problems?
The main task of the SVM is to maximize the distance between the margins such that no point crosses the margin. This is also called “Hard Margin SVM”.
In an ideal world, the above condition will never violate and the distance can be calculated as:

But in the real world, we always get impure data with some outliers and if we follow the hard margin concept then we will not able to create any hyperplane. So, a new concept was introduced that is “Soft Margin SVM”.In this, we introduce a new element that is “Hinge Loss”.

In soft margin SVM hinge function is the summation of the distance between the outlier points and the margin which is then multiplied with a hyperparameter “C”.

In regression, SVM takes a little bit different approach. This approach can be explained using three lines. The first line is the best fit regressor line, and the other two lines are the bordering ones that denote the range of error.
In other words, the best fit line(or the hyperplane) will be the line that goes through the maximum number of data points, and the error boundaries are chosen to ensure maximum inclusion.
What are the advantages and disadvantages of a Support Vector Machine?
Advantages:
- SVM is effective in high-dimensional space.
- It is still effective in cases where a number of dimensions are greater than the number of samples
- SVM is memory efficient.
Disadvantages:
- If the number of features is much greater than the number of samples, then it avoids over-fitting in choosing the kernel function.
- SVM does not directly provide probability estimation like Logistic Regression.
How to implement Support Vector Machine using Scikit-learn?
The implementation of SVM is very simple and easy. We have to just import the sklearn package. For this example, we are using a toy dataset that is already present in the sklearn package and the example is of a classification problem. Also, we will import some necessary packages from python.

Now, extracting the data

we are using the Breast cancer Wisconsin (diagnostic) dataset.
Data Set Characteristics:

 :Number of Instances: 569

 :Number of Attributes: 30 numeric, predictive attributes and the class

 :Attribute Information:
 - radius (mean of distances from center to points on the perimeter)
 - texture (standard deviation of gray-scale values)
 - perimeter
 - area
 - smoothness (local variation in radius lengths)
 - compactness (perimeter^2 / area - 1.0)
 - concavity (severity of concave portions of the contour)
 - concave points (number of concave portions of the contour)
 - symmetry
 - fractal dimension ("coastline approximation" - 1)
- class:
 - WDBC-Malignant
 - WDBC-Benign
split the dataset into training, testing sets.

now train the model using the training data then predict the outcome of testing data
NOTE: SVC has many hyperparameters which we can tune to get better result.

Last measure the accuracy using confusion matrix, accuracy_score and F1_score

link of the notebook used in this article:
Articles_Blogs_Content/All About Support Vector Machine .ipynb at main ·…
This repository contains jupyter notebooks regarding the Articles published in blogs. – Articles_Blogs_Content/All…
github.com
Like and Share if you find this article helpful. Also, follow me on medium for more content related to Machine Learning and Deep Learning.
Join thousands of data leaders on the AI newsletter. Join over 80,000 subscribers and keep up to date with the latest developments in AI. From research to projects and ideas. If you are building an AI startup, an AI-related product, or a service, we invite you to consider becoming a sponsor.
Published via Towards AI
Take our 90+ lesson From Beginner to Advanced LLM Developer Certification: From choosing a project to deploying a working product this is the most comprehensive and practical LLM course out there!
Towards AI has published Building LLMs for Production—our 470+ page guide to mastering LLMs with practical projects and expert insights!

Discover Your Dream AI Career at Towards AI Jobs
Towards AI has built a jobs board tailored specifically to Machine Learning and Data Science Jobs and Skills. Our software searches for live AI jobs each hour, labels and categorises them and makes them easily searchable. Explore over 40,000 live jobs today with Towards AI Jobs!
Note: Content contains the views of the contributing authors and not Towards AI.


