


All Statistical Tests using Python: Mastering Statistics | Part — 1
Last Updated on July 17, 2023 by Editorial Team
Author(s): Simranjeet Singh
Originally published on Towards AI.
All Statistical Tests using Python: Mastering Statistics U+007C Part — 1
Introduction
Welcome to “Mastering Statistical Tests with Python: A Comprehensive Guide.” that will go over all the fundamental statistical tests and analysis methods you need to be familiar with using Python in this manual. This article will provide you a thorough introduction of statistical tests and their applications, whether you’re a novice or an experienced data scientist.
U+1F449 Before Starting the Blog, Please Subscribe to my YouTube Channel and Follow Me on Instagram U+1F447
U+1F4F7 YouTube — https://bit.ly/38gLfTo
U+1F4C3 Instagram — https://bit.ly/3VbKHWh
U+1F449 Do Donate U+1F4B0 or Give me Tip U+1F4B5 If you really like my blogs, Because I am from India and not able to get into Medium Partner Program. Click Here to Donate or Tip U+1F4B0 — https://bit.ly/3oTHiz3
Using practical examples from the real world and Python code snippets to help you understand the ideas, we’ll cover everything from hypothesis testing and tests conducted as part of it. So let’s get going!
Statistics
The study of statistics focuses on gathering, organizing, analyzing, interpreting, and presenting data. It is conventional to start with a statistical population or a statistical model to be researched when applying statistics to a scientific, industrial, or social problem.
Types of Statistics in Maths
Statistics have been majorly categorized into two types:
- Descriptive statistics
- Inferential statistics
Descriptive Statistics
The data is summarised in this form of statistics using the provided observations. The summary is a representation of a population sample utilizing metrics like the mean or standard deviation.
Using tables, graphs, and summary statistics, descriptive statistics is a means to arrange, portray, and describe a collection of data. Consider the number of people utilizing the internet or television in a city.
Descriptive statistics are also categorized into four different categories:
- Measure of frequency
- Measure of dispersion
- The measure of central tendency
- Measure of position
The frequency measurement shows how frequently a given piece of data happens. Measures of dispersion include range, variance, and standard deviation. It shows how the data has spread. The data’s mean, median, and mode are the main tendencies. The percentile and quartile ranks are described by the measure of position.
Inferential Statistics
Descriptive statistics are interpreted using this type of statistics. In other words, after the data has been gathered, examined, and summarised, we use these statistics to explain the significance of the data. Or, as another way to put it, it is used to derive inferences from data that is subject to random errors like observational errors, sampling variance, etc.
With the help of inferential statistics, we can use data gathered from a sample to extrapolate conclusions about the population. It enables us to make claims that go beyond the scope of the facts or data at hand. Creating estimations, as an illustration, using fictitious research.
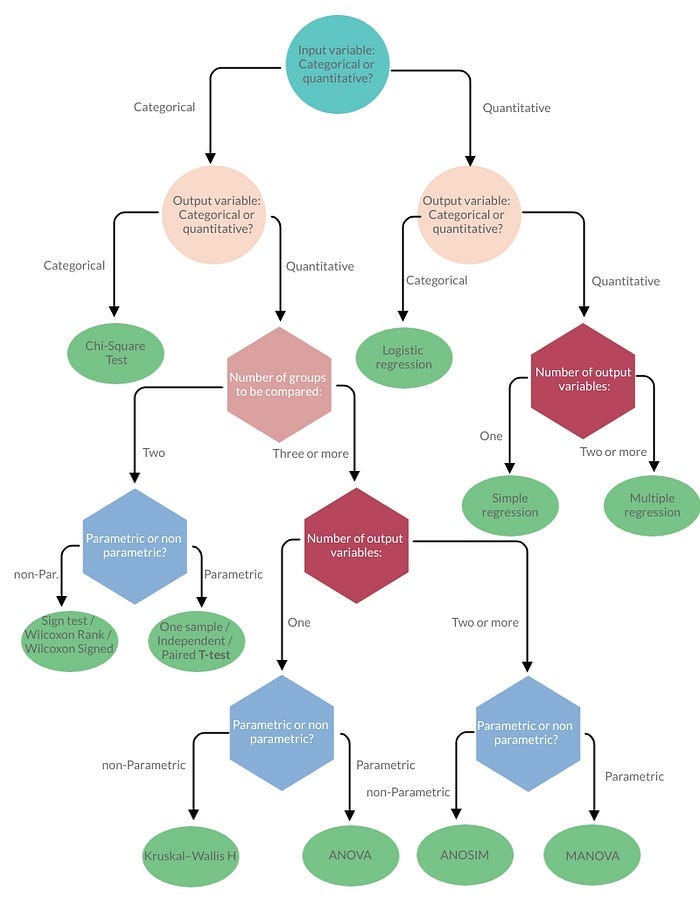
Statistical Tests in Data Science
Statistical tests are used in hypothesis testing. They can be used to determine whether a predictor variable and an outcome variable have a statistically significant relationship. the difference between two or more groups should be estimated. Parametric tests are used if the data is normally distributed.
Statistic tests are divided into two main categories:
- Parametric
- Non-Parametric
Assumptions to be Assumed or Check:
I. Independence of observations: The separate observations (each variable entry) are unrelated to one another (for instance, repeating the same test on a single patient generates non-independent measurements, that is, repeated measurements).
II. Normality of data: The data follows a normal distribution. This assumption is required only for quantitative data. (For more details, see also here)
III. Homogeneity of variance: Each group being compared has a similar variance (i.e., the distribution, or “spread,” of scores around the mean). The “power” of the test to detect differences will be diminished if one group has significantly greater variation than the others.
Alternately, you can employ tests that take this circumstance into account if your data do not meet the premise of observational independence (i.e., repeated-measures tests).
If your data, instead, do not satisfy the assumptions of normality or homogeneity of variance, you may be able to perform a non-parametric statistical test, which allows you to make comparisons without these two assumptions.
The following Type of Tests are Explained with Code:
- Z — Test
- T — Test
- ANNOVA Test
- Chi-Squared Test
- Correlation Test
Z-Test
Z-Test is a statistical test used to compare a sample mean to a population mean when the population standard deviation is known. In simple terms,
- It is a statistical test to determine whether two population means are different when the variances are known and the sample size is large.
- It applies in hypothesis test in which the z-statistic follows a normal distribution.
- A Z-Statistic, or Z-Score, is a number representing the result from the Z-test.
To understand the Z-Test, let’s look at a real-world example. Let’s say a shoe firm claims that the typical lifespan of their footwear is 500 days. We gather a sample of 50 shoes to test this assertion, and we discover that the average lifespan is 490 days, with a standard deviation of 25 days. We can now run a Z-Test to see if the sample backs up the company’s claim or not.
When to Use Z-test:
- The sample size should be greater than 30. Otherwise, we should use the t-test.
- Samples should be drawn at random from the population.
- The standard deviation of the population should be known.
- Samples that are drawn from the population should be independent of each other.
- The data should be normally distributed, however for large sample size, it is assumed to have a normal distribution.
Steps to perform Z-test:
- First, identify the null and alternate hypotheses.
- Determine the level of significance (∝).
- Find the critical value of z in the z-test using.
- Calculate the z-test statistics. Below is the formula for calculating the z-test statistics.

If the p-value is BELOW the threshold (meaning smaller than), then you can infer a statistically significant relationship between the input and target variables.
Otherwise, then you can infer no statistically significant relationship between the predictor and outcome variables.
One Sample Z-Test in Python
Suppose the IQ in a certain population is normally distributed with a mean of μ = 100 and a standard deviation of σ = 15.
A researcher wants to know if a new drug affects IQ levels (YES or NO [Categorical]), so he recruits 20 patients to try it and records their IQ levels.
The following code shows how to perform a one-sample z-test in Python to determine if the new drug causes a significant difference in IQ levels:
from statsmodels.stats.weightstats import ztest as ztest
"""
H0 : New Drug not Affects the IQ
H1 : New Drug Does Affects the IQ
"""

#enter IQ levels for 20 patients
data = [88, 92, 94, 94, 96, 97, 97, 97, 99, 99,
 105, 109, 109, 109, 110, 112, 112, 113, 114, 115]

#perform one sample z-test
ztest(data, value=100)
The test statistic for the one sample z-test is 1.5976, and the corresponding p-value is 0.1101.
Since this p-value is not less than .05, we do not have sufficient evidence to reject the null hypothesis. In other words, the new drug does not significantly affect IQ levels.
Two Sample Z-Test in Python
Suppose the IQ levels among individuals in two different cities are known to be normally distributed with known standard deviations.
A researcher chooses a basic random sample of 20 people from each city and records their IQ levels in order to determine whether the mean IQ levels of people in cities A and B differ from one another.
The following code shows how to perform a two-sample z-test in Python to determine if the mean IQ level is different between the two cities:
from statsmodels.stats.weightstats import ztest as ztest

"""
H0 : Mean is not Different
H1 : Mean is Different
"""

#enter IQ levels for 20 individuals from each city
cityA = [82, 84, 85, 89, 91, 91, 92, 94, 99, 99,
 105, 109, 109, 109, 110, 112, 112, 113, 114, 114]

cityB = [90, 91, 91, 91, 95, 95, 99, 99, 108, 109,
 109, 114, 115, 116, 117, 117, 128, 129, 130, 133]

#perform two sample z-test
ztest(cityA, cityB, value=0)
The test statistic for the two sample z-test is -1.9953 and the corresponding p-value is 0.0460.
Since this p-value is less than .05, we have sufficient evidence to reject the null hypothesis. In other words, the mean IQ level is significantly different between the two cities.
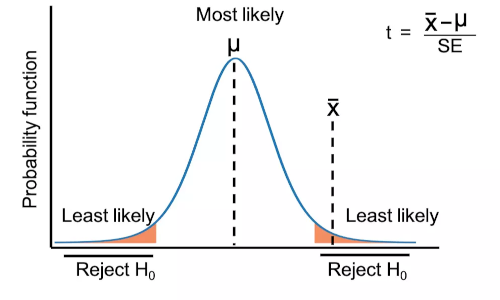
T-Test
The T-Test statistical test is used to determine whether there is a significant difference between the means of the two groups. In relation to the variation between the means of two groups, it estimates the variance within the groupings. This test is particularly useful when the sample size is small, and the population standard deviation is unknown.
- T-test is a parametric inferential statistical method used for comparing the means between two different groups (two-sample t-test) or with the specific value (one-sample t-test).
- In t-test, test statistic follows the t-distribution (type of continuous probability distribution) under the null hypothesis.
- The t-test was created specifically for small sample size data (n 30), in contrast to the z-test, which needs a higher sample size (t and z distributions are similar for bigger sample size, say n=30). The t-test is also applicable to data with a very small sample size (n 5). For datasets with limited sample sizes, the t-test yields more conservative results.
- T-test has three main types: One Sample t-test, two-sample t-test (unpaired or independent), and paired t-test.
- One-sample t-tests compare the sample mean to the hypothesized values, whereas two-sample t-tests (also known as independent or unpaired t-tests) compare the means of two independent groups. The differences between the two dependent variables are compared in a paired t-test.
One Sample t-test
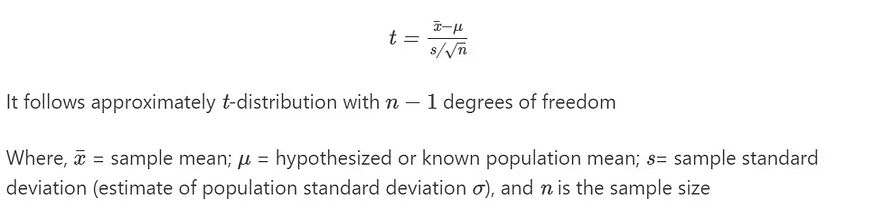
- One Sample t-test (single sample t-test) is used to compare the sample mean (a random sample from a population) with the specific value (hypothesized or known mean of the population).
- For example, a ball has a diameter of 5 cm, and we want to check whether the average diameter of the ball from the random sample (e.g., 50 balls) picked from the production line differs from the known size.
Assumptions
- The dependent variable should have an approximately normal distribution (Shapiro-Wilks Test)
- Observations are independent of each other
Hypotheses
- Null hypothesis: The sample mean is equal to the hypothesized or known population mean
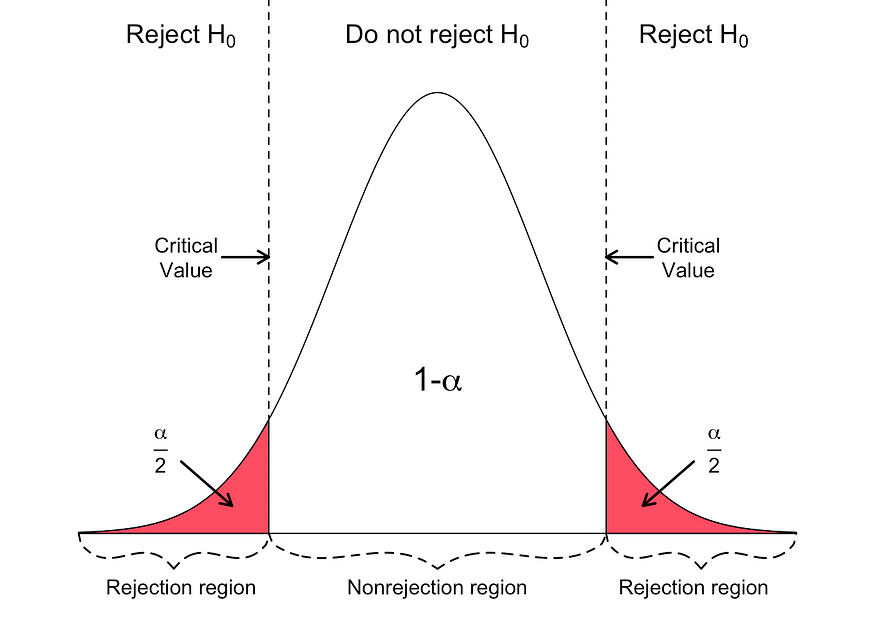
- Alternative hypothesis: The sample mean is not equal to the hypothesized or known population mean (two-tailed or two-sided)
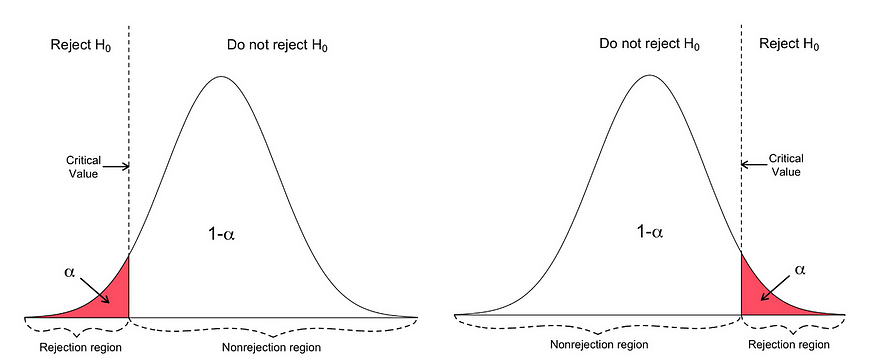
- Alternative hypothesis: The sample mean is either greater or lesser than the hypothesized or known population mean (one-tailed or one-sided).
from scipy import stats as st
from bioinfokit.analys import get_data
# load dataset as pandas dataframe
df = get_data('t_one_samp').data
df.head(2)
# output
#size
#0 5.739987
#1 5.254042

# t test using scipy
a = df['size'].to_numpy()
# use parameter "alternative" for two-sided or one-sided test
st.ttest_1samp(a=a, popmean=5)
# Using only Bioinfokit
from bioinfokit.analys import stat
res = stat()
res.ttest(df=df,test_type=1, res='size',mu=5)
print(res.summary)
The p-value obtained from the one sample t-test is not significant (p > 0.05), and therefore, we conclude that the average diameter of balls in a random sample is equal to 5 cm.
Two sample t-test
The two-sample (unpaired or independent) t-test evaluates whether the means of two independent groups are equal or statistically different by comparing them. In a two-sample t-test, the sample means from the two groups are typically computed, and the conclusion is formed for the population’s means (unknown means) from which the two groups were selected.
For instance, we have two distinct plant genotypes (genotype A and genotype B), and we want to see if genotype A’s yield differs considerably from genotype B’s.
Hypotheses
- Null hypothesis: Two group means are equal
- Alternative hypothesis: Two group means are different (two-tailed or two-sided)
- Alternative hypothesis: Mean of one group either greater or lesser than another group (one-tailed or one-sided)
Assumptions
- Observations in two groups have an approximately normal distribution (Shapiro-Wilks Test)
- Homogeneity of variances (variances are equal between treatment groups) (Levene or Bartlett Test)
- The two groups are sampled independently from each other from the same population.
Note: Two sample t-test is relatively robust to the assumption of normality and homogeneity of variances when the sample size is large (n ≥ 30) and there is an equal number of samples (n1 = n2) in both groups.
If the sample size is small and does not follow the normal distribution, you should use the non-parametric Mann-Whitney U test.
Two samples (independent) t-test formula –
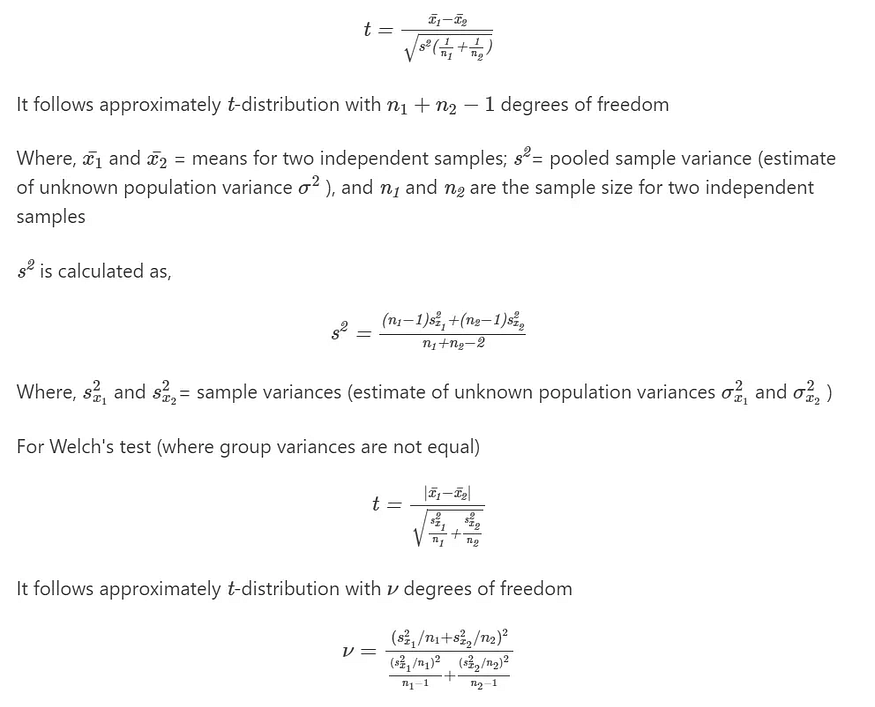
If the variances are equal, the two-sample t-test and Welch’s test (unequal variance t-test) perform equally (in terms of type I error rate) and have similar power.
Calculate Two sample t-test in Python:
# Perform two sample t-test using SciPy
# install bioinfokit as !pip install bioinfokit
!pip install bioinfokit
from scipy import stats as st
from bioinfokit.analys import get_data
# load dataset as pandas dataframe
df = get_data('t_ind_samp').data
df.head(2)

a = df.loc[df['Genotype'] == 'A', 'yield'].to_numpy()
b = df.loc[df['Genotype'] == 'B', 'yield'].to_numpy()
st.ttest_ind(a=a, b=b, equal_var=True)

# Perform two sample t-test using bioinfokit
from bioinfokit.analys import stat
res = stat()
# for unequal variance t-test (Welch's t-test) set evar=False
res.ttest(df=df, xfac="Genotype", res="yield", test_type=2, evar=False)
print(res.summary)
Note: Although it is possible to do a t-test when the sample sizes of the two groups are not identical, it is more effective to have an equal sample size in each group to boost the t-power. test’s
The p-value obtained from the t-test is significant (p < 0.05), and therefore, we conclude that the yield of genotype A is significantly different than genotype B.
Paired t-test
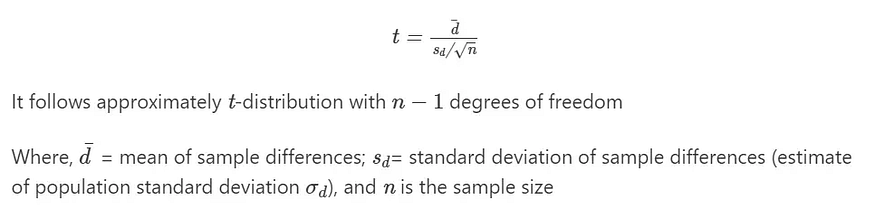
- Paired t-test was used to compare the differences between the pair of dependent variables for the same subject
- For example, we have plant variety A and would like to compare the yield of A before and after the application of some fertilizer.
- Note: Paired t-test is a one-sample t-test on the differences between the two dependent variables
Hypothesis
- Null hypothesis: There is no difference between the two dependent variables (difference=0)
- Alternative hypothesis: There is a difference between the two dependent variables (two-tailed or two-sided)
- Alternative hypothesis: Difference between two response variables either greater or lesser than zero (one-tailed or one-sided)
Assumptions
- Differences between the two dependent variables follow an approximately normal distribution (Shapiro-Wilks Test)
- The Independent variable should have a pair of dependent variables
- Differences between the two dependent variables should not have outliers
- Observations are sampled independently from each other
# install bioinfokit as !pip install bioinfokit
from bioinfokit.analys import get_data, stat
# load dataset as pandas dataframe
# the dataset should not have missing (NaN) values. If it has, it will omitted
df = get_data('t_pair').data
df.head(2)

res = stat()
res.ttest(df=df, res=['AF', 'BF'], test_type=3)
print(res.summary)
The p-value obtained from the t-test is significant (p < 0.05), and therefore, we conclude that the yield of plant variety A significantly increased by the application of fertilizer.
Note: If you have partially paired data, you can do a paired t-test with all unpaired observations or use an independent t-test by considering the two dependent variables as two separate samples. Both ad hoc approaches, however, are inappropriate since they fail to meet the fundamental condition and could result in a skewed estimation of the variance and information loss.
- The t-test can be applied for the extremely small sample size (n = 2 to 5) provided the effect size is large and data follows the t-test assumptions. Remember, a larger sample size is preferred over small sample sizes.
- For paired t-test, it is advisable to have a high within-pair correlation (r > 0.8) to get a high statistical power (>80%) for small sample size data.
- t-test is relatively robust to the assumption of normality and homogeneity of variances when the sample size is large (n ≥ 30).
In the next blog, I will talk about Chi-Squared Test, ANNOVA Test, and Correlation Test
Final Thoughts
You can master data analysis and develop reliable findings by learning T-test and Z-test in depth using Python. The Z-test is used to evaluate assumptions about population means, whereas the T-test is used to discover whether there is a significant difference between two groups. With experience and a working grasp of these statistical tests, you’ll be able to handle challenging issues and offer insightful advice to your company.
If you like the article and would like to support me make sure to:
U+1F44F Clap for the story (100 Claps) and follow me U+1F449U+1F3FBSimranjeet Singh
U+1F4D1 View more content on my Medium Profile
U+1F514 Follow Me: LinkedIn U+007C Medium U+007C GitHub U+007C Twitter U+007C Telegram
U+1F680 Help me in reaching to a wider audience by sharing my content with your friends and colleagues.
U+1F393 If you want to start a career in Data Science and Artificial Intelligence and you do not know how? I offer data science and AI mentoring sessions and long-term career guidance.
U+1F4C5 Consultation or Career Guidance
U+1F4C5 1:1 Mentorship — About Python, Data Science, and Machine Learning

Join thousands of data leaders on the AI newsletter. Join over 80,000 subscribers and keep up to date with the latest developments in AI. From research to projects and ideas. If you are building an AI startup, an AI-related product, or a service, we invite you to consider becoming a sponsor.
Published via Towards AI
Towards AI Academy
We Build Enterprise-Grade AI. We'll Teach You to Master It Too.
15 engineers. 100,000+ students. Towards AI Academy teaches what actually survives production.
Start free — no commitment:
→ 6-Day Agentic AI Engineering Email Guide — one practical lesson per day
→ Agents Architecture Cheatsheet — 3 years of architecture decisions in 6 pages
Our courses:
→ AI Engineering Certification — 90+ lessons from project selection to deployed product. The most comprehensive practical LLM course out there.
→ Agent Engineering Course — Hands on with production agent architectures, memory, routing, and eval frameworks — built from real enterprise engagements.
→ AI for Work — Understand, evaluate, and apply AI for complex work tasks.
Note: Article content contains the views of the contributing authors and not Towards AI.
Related posts
Recent Posts


")

