How To Build Your Own K-Means Algorithm Implementation in Python From Scratch With K-Means++ Initialization
Last Updated on July 17, 2023 by Editorial Team
Author(s): Alex Belengeanu
Originally published on Towards AI.
What’s a better method to deepen your knowledge about algorithm principles than implementing it from 0 by yourself?

What is K-Means?
K-Means is an unsupervised machine learning technique used to split up a number of ‘n’ observations into ‘k’ different clusters, where each observation belongs to the cluster with the closest centroid. The result will be a partition of the dataset into Voronoi Cells.
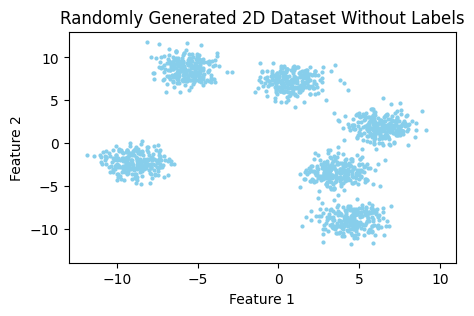
Suppose we have a dataset that consists of two features.

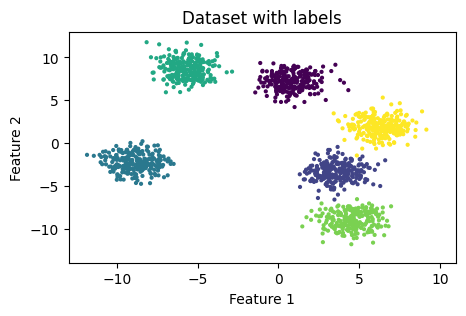
As you can notice in Figure 1, it’s easily distinguishable by the eye that this dataset can be partitioned into six different clusters (or groups). But how does the algorithm determine which observation belongs to which cluster?
In order to assign each sample a specific group, the K-Means algorithm follows the following steps :
- Initialize ‘k’ centroids, one for each cluster.
- Assign each sample a cluster based on the closest centroid.
- Recompute cluster centers based on the assigned points.
- Repeat steps 2 and 3 until the centroids do not change anymore.
Voilà, that’s how K-Means reaches the final result.
K-Means use cases
Some of the most common use cases for this clustering algorithm include topics such as search engines, anomaly detection, and segmentation of customers based of previous behavior (interests, purchases etc.)
Initialization method for centroids
One important thing we should take into consideration is that the final results will depend on the initialization method of the cluster centers. Two of the most used initialization methods are ‘random’ and ‘k-means++’. The main difference between those two is that ‘k-means++’ is trying to push the centroids as far from one another as possible, which means that it will converge faster to the final solution.
For this implementation, we will be using ‘k-means++’ as the initialization method.
Implementation
class myKMeans:
 def __init__(self, n_clusters, iters):
 """
 KMeans Class constructor.

 Args:
 n_clusters (int) : Number of clusters used for partitioning.
 iters (int) : Number of iterations until the algorithm stops.

 """
 self.n_clusters = n_clusters
 self.iters = iters

 def kmeans_plus_plus(self, X, n_clusters):
 pass

 def find_closest_centroids(self, X, centroids):
 pass

 def compute_centroids(self, X, idx, K):
 pass

 def fit_predict(self, X):
 pass
This is the structure of the class that we will build. The ‘kmeans_plus_plus()’, ‘find_closest_centroids()’ and ‘compute_centroids()’ methods will implement the 1st, 2nd and 3rd steps of the algorithm respectively. The ‘fit_predict()’ method will take the dataset and make a prediction on the labels.
def kmeans_plus_plus(self, X, n_clusters):
 """
 My implementation of the KMeans++ initialization method for computing the centroids.

 Args:
 X (ndarray): Dataset samples
 n_clusters (int): Number of clusters

 Returns:
 centroids (ndarray): Initial position of centroids
 """
 # Assign the first centroid to a random sample from the dataset.
 idx = random.randrange(len(X))
 centroids = [X[idx]]

 # For each cluster
 for _ in range(1, n_clusters):

 # Get the squared distance between that centroid and each sample in the dataset
 squared_distances = np.array([min([np.inner(centroid - sample,centroid - sample) for centroid in centroids]) for sample in X])

 # Convert the distances into probabilities that a specific sample could be the center of a new centroid
 proba = squared_distances / squared_distances.sum()

 for point, probability in enumerate(proba):
 # The farthest point from the previous computed centroids will be assigned as the new centroid as it has the highest probability.
 if probability == proba.max():
 centroid = point
 break

 centroids.append(X[centroid])

 return np.array(centroids)
The function above implements the first step (the initialization method) of the K-Means algorithm.
We take a random sample from the dataset and assign it as the first centroid. After that, we repeatedly compute the distance between each sample and all centroids and assign all the remaining centroids to the farthest points from the previously computed centers.
def find_closest_centroids(self, X, centroids):
 """
 Computes the distance to the centroids and assigns the new label to each sample in the dataset.

 Args:
 X (ndarray): Dataset samples
 centroids (ndarray): Number of clusters

 Returns:
 idx (ndarray): Closest centroids for each observation

 """

 # Set K as number of centroids
 K = centroids.shape[0]

 # Initialize the labels array to 0
 label = np.zeros(X.shape[0], dtype=int)

 # For each sample in the dataset
 for sample in range(len(X)):
 distance = []
 # Take every centroid
 for centroid in range(len(centroids)):
 # Compute Euclidean norm between a specific sample and a centroid
 norm = np.linalg.norm(X[sample] - centroids[centroid])
 distance.append(norm)

 # Assign the closest centroid as it's label
 label[sample] = distance.index(min(distance))

 return label
The function above implements the second step (finding the closest centroids) of the K-Means algorithm.
For each sample in the dataset, we take each centroid and compute the Euclidean norm between them. We store that in a list, and at the end, we assign the observation to the closest centroid.
def compute_centroids(self, X, idx, K):
 """
 Returns the new centroids by computing the mean of the data points assigned to each centroid.

 Args:
 X (ndarray): Dataset samples
 idx (ndarray): Closest centroids for each observation
 K (int): Number of clusters

 Returns:
 centroids (ndarray): New centroids computed
 """

 # Number of samples and features
 m, n = X.shape

 # Initialize centroids to 0
 centroids = np.zeros((K, n))

 # For each centroid
 for k in range(K):
 # Take all samples assigned to that specific centroid
 points = X[idx == k]
 # Compute their mean
 centroids[k] = np.mean(points, axis=0)

 return centroids
The function above implements the third step (recomputing the new cluster centers) of the K-Means algorithm.
For each centroid, we take all the assigned points to that specific group and calculate their mean. The result will give us the new center of the cluster.
def fit_predict(self, X):
 """
 My implementation of the KMeans algorithm.

 Args:
 X (ndarray): Dataset samples

 Returns:
 centroids (ndarray): Computed centroids
 labels (ndarray): Predicts for each sample in the dataset.
 """
 # Number of samples and features
 m, n = X.shape

 # Compute initial position of the centroids
 initial_centroids = self.kmeans_plus_plus(X, self.n_clusters)

 centroids = initial_centroids
 labels = np.zeros(m)

 prev_centroids = centroids

 # Run K-Means
 for i in range(self.iters):
 # For each example in X, assign it to the closest centroid
 labels = self.find_closest_centroids(X, centroids)

 # Given the memberships, compute new centroids
 centroids = self.compute_centroids(X, labels, self.n_clusters)

 # Check if centroids stopped changing positions
 if centroids.tolist() == prev_centroids.tolist():
 print(f'K-Means converged at {i+1} iterations')
 break
 else:
 prev_centroids = centroids

 return centroids, labels
Last but not least, the ‘fit_predict()’ function will be called to make a prediction on the samples in our dataset.
Finally, your K-Means class should look something like this :
class myKMeans:
 def __init__(self, n_clusters, iters):
 """
 KMeans Class constructor.

 Args:
 n_clusters (int) : Number of clusters used for partitioning.
 iters (int) : Number of iterations until the algorithm stops.

 """
 self.n_clusters = n_clusters
 self.iters = iters

 def kmeans_plus_plus(self, X, n_clusters):
 """
 My implementation of the KMeans++ initialization method for computing the centroids.

 Args:
 X (ndarray): Dataset samples
 n_clusters (int): Number of clusters

 Returns:
 centroids (ndarray): Initial position of centroids
 """
 # Assign the first centroid to a random sample from the dataset.
 idx = random.randrange(len(X))
 centroids = [X[idx]]

 # For each cluster
 for _ in range(1, n_clusters):

 # Get the squared distance between that centroid and each sample in the dataset
 squared_distances = np.array([min([np.inner(centroid - sample,centroid - sample) for centroid in centroids]) for sample in X])

 # Convert the distances into probabilities that a specific sample could be the center of a new centroid
 proba = squared_distances / squared_distances.sum()

 for point, probability in enumerate(proba):
 # The farthest point from the previous computed centroids will be assigned as the new centroid as it has the highest probability.
 if probability == proba.max():
 centroid = point
 break

 centroids.append(X[centroid])

 return np.array(centroids)

 def find_closest_centroids(self, X, centroids):
 """
 Computes the distance to the centroids and assigns the new label to each sample in the dataset.

 Args:
 X (ndarray): Dataset samples
 centroids (ndarray): Number of clusters

 Returns:
 idx (ndarray): Closest centroids for each observation

 """

 # Set K as number of centroids
 K = centroids.shape[0]

 # Initialize the labels array to 0
 label = np.zeros(X.shape[0], dtype=int)

 # For each sample in the dataset
 for sample in range(len(X)):
 distance = []
 # Take every centroid
 for centroid in range(len(centroids)):
 # Compute Euclidean norm between a specific sample and a centroid
 norm = np.linalg.norm(X[sample] - centroids[centroid])
 distance.append(norm)

 # Assign the closest centroid as it's label
 label[sample] = distance.index(min(distance))

 return label

 def compute_centroids(self, X, idx, K):
 """
 Returns the new centroids by computing the mean of the data points assigned to each centroid.

 Args:
 X (ndarray): Dataset samples
 idx (ndarray): Closest centroids for each observation
 K (int): Number of clusters

 Returns:
 centroids (ndarray): New centroids computed
 """

 # Number of samples and features
 m, n = X.shape

 # Initialize centroids to 0
 centroids = np.zeros((K, n))

 # For each centroid
 for k in range(K):
 # Take all samples assigned to that specific centroid
 points = X[idx == k]
 # Compute their mean
 centroids[k] = np.mean(points, axis=0)

 return centroids

 def fit_predict(self, X):
 """
 My implementation of the KMeans algorithm.

 Args:
 X (ndarray): Dataset samples

 Returns:
 centroids (ndarray): Computed centroids
 labels (ndarray): Predicts for each sample in the dataset.
 """
 # Number of samples and features
 m, n = X.shape

 # Compute initial position of the centroids
 initial_centroids = self.kmeans_plus_plus(X, self.n_clusters)

 centroids = initial_centroids
 labels = np.zeros(m)

 prev_centroids = centroids

 # Run K-Means
 for i in range(self.iters):
 # For each example in X, assign it to the closest centroid
 labels = self.find_closest_centroids(X, centroids)

 # Given the memberships, compute new centroids
 centroids = self.compute_centroids(X, labels, self.n_clusters)

 # Check if centroids stopped changing positions
 if centroids.tolist() == prev_centroids.tolist():
 print(f'K-Means converged at {i+1} iterations')
 break
 else:
 prev_centroids = centroids

 return labels, centroids
Cool. Now let’s see how the results of our implementation look like compared to the sklearn version of K-Means 🙂 For that, we need to import the following dependencies :
import random
import numpy as np
import matplotlib.pyplot as plt
from sklearn.cluster import KMeans
Next, we need a dataset on which we will perform the clustering. For the sake of simplicity, I will generate a dummy dataset using ‘make_blobs()’ function from sklearn.datasets.
from sklearn.datasets import make_blobs

# Generate 2D classification dataset
X, y = make_blobs(n_samples=1500, centers=6, n_features=2, random_state=67)
The code snippet from above will generate us the following dataset :

Now, let’s run both versions of K-Means (own and sklearn implementations) and see how they perform.
# sklearn version of KMeans
kmeans = KMeans(n_clusters=5)
sklearn_labels = kmeans.fit_predict(X)
sklearn_centers = kmeans.cluster_centers_

# own implementation of KMeans
my_kmeans = myKMeans(5, 50)
mykmeans_labels, mykmeans_centers = my_kmeans.fit_predict(X)
Great. Now that we have the inferences let’s visualize them together with the Voronoi Cells.U+1F601
plt.figure(figsize=(12,4))
vor = Voronoi(sklearn_centers)
fig = voronoi_plot_2d(vor, plt.subplot(1, 2, 1))
plt.subplot(1, 2, 1)
plt.title("sklearn KMeans Predicts")
plt.xlabel("Feature 1")
plt.ylabel("Feature 2")
plt.xlim([-13, 11])
plt.ylim([-14, 13])
plt.scatter(X[:, 0], X[:, 1], 4, c=sklearn_labels)
plt.scatter(sklearn_centers[:, 0], sklearn_centers[:, 1], marker='x', c='red', s=50)
vor = Voronoi(mykmeans_centers)
fig = voronoi_plot_2d(vor, plt.subplot(1, 2, 2))
plt.subplot(1, 2, 2)
plt.title("My KMeans Predicts")
plt.xlabel("Feature 1")
plt.ylabel("Feature 2")
plt.xlim([-13, 11])
plt.ylim([-14, 13])
plt.scatter(X[:, 0], X[:, 1], 4, c=mykmeans_labels)
plt.scatter(mykmeans_centers[:, 0], mykmeans_centers[:, 1], marker='x', c='red', s=50)
plt.show()

Wow. That looks really impressive if you ask me. The results are pretty much the same.
Conclusions
To sum up, this is more or less everything that you need to know about this powerful clustering algorithm. I hope that this article helped you get a glance at K-Means principles. Thanks for reading!
If you have any observations about the article, write them in the comments! I’d love to read them U+1F60B
About me
Hi, my name is Alex, and I’m a young and passionate student in Machine Learning and Data Science.
If you liked the content, please consider dropping a follow and claps, as they are really appreciated. Also, feel free to connect with me on LinkedIn in order to get some weekly insights on machine learning-related topics.
References
[1] David Arthur and Sergei Vassilvitskii, k-means++: The Advantages of Careful Seeding (2007), http://ilpubs.stanford.edu:8090/778/1/2006-13.pdf
[2] https://en.wikipedia.org/wiki/K-means_clustering#Applications
[3] https://www.kdnuggets.com/2020/06/centroid-initialization-k-means-clustering.html
Join thousands of data leaders on the AI newsletter. Join over 80,000 subscribers and keep up to date with the latest developments in AI. From research to projects and ideas. If you are building an AI startup, an AI-related product, or a service, we invite you to consider becoming a sponsor.
Published via Towards AI
Take our 90+ lesson From Beginner to Advanced LLM Developer Certification: From choosing a project to deploying a working product this is the most comprehensive and practical LLM course out there!
Towards AI has published Building LLMs for Production—our 470+ page guide to mastering LLMs with practical projects and expert insights!

Discover Your Dream AI Career at Towards AI Jobs
Towards AI has built a jobs board tailored specifically to Machine Learning and Data Science Jobs and Skills. Our software searches for live AI jobs each hour, labels and categorises them and makes them easily searchable. Explore over 40,000 live jobs today with Towards AI Jobs!
Note: Content contains the views of the contributing authors and not Towards AI.


