
Blue vs Green, Dimensions vs Measures, Discrete vs Continuous: A Road to Tableau Desktop Specialist Certification
Last Updated on July 26, 2023 by Editorial Team
Author(s): Daksh Trehan
Originally published on Towards AI.
Chapter 6: Clear Comparison between Blue & Green pills, Dimensions & Measures, Discrete & Continuous, Measure Names & Measure Values with sample questions

Welcome to the sixth chapter, In this piece, we are going to learn about Dimensions, Measures, Blue Pills, Green Pills, Discrete & Continuous values.
If you want to navigate through other chapters, visit:
Tableau: What it is? Why it is the best?; A road to Tableau Desktop Specialist Certification.
If you want to directly go on Tableau Desktop Specialist notes, access them here → https://dakshtrehan.notion.site/Tableau-Notes-c13fceda97b94bda940edbf6751cf30
Use the link to get access to free Tableau certification dumps (Valid till 6 July 2022):
Whenever we load some data in Tableau, the data fields are automatically assigned a Role & a Type.
A data field could be assigned two roles:
- Dimension
- Measure
A data field can correspond to the following data types:
- String
- Number
- Geographic
- Boolean
- Date
- Date & Time
To know more about Data Types, refer to Data Types in Tableau: Using & Cleaning
Table of Content
- Dimension vs Measures [WHAT]
– Default Properties: Dimension vs Measures
– Colors: Dimension vs Measures - Discrete(Blue) vs Continuous(Green) [HOW]
– Filters: Discrete vs Continuous - Putting it all together!
– Converting Dimension to Measure and Vice-Versa
– Converting Discrete to Continuous and Vice-Versa
– Dimension in the View
– Measure in the View - Measure Values & Measure Names
- Sample Exam Questions from this Topic
Dimension vs Measure
Dimension in Tableau stands for any data field that contains qualitative values i.e. values that are descriptive.
Measures in Tableau stand for any data field that contains quantitative values i.e. values that conveys information in the form of numerals. In simpler words, anything on which we can perform aggregations(sum, count, avg, etc.)
Whenever we take Measures to our Row/Column shelf, it is automatically aggregated(by default: sum).
Tableau automatically divides the data into Dimension and Measure, it also provides the flexibility to toggle the data between two roles.

Dimensions + Measures : WHAT?
Dimension & Measures helps to understand more about the data i.e. what it represents/means.
Dimensions: Independent Variables
Measures: Dependent Variables
A Dimension always affects the Level of Detail i.e. more dimensions lead to more granular data. In simpler words, the more dimensions you add, the more marks will be created in our view.
Tableau automatically generates(displayed in italic format):

1 Dimension — Measure Names
4 Measures — Latitude, Longitude, Number of records, Measure Values
The dimensions that define how to group the calculation (the scope of data it is performed on) are called partitioning fields.
The remaining dimensions, upon which the table calculation is performed, are called addressing fields, and determine the direction of the calculation.
Default Properties: Dimension vs Measure
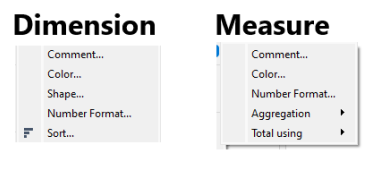
If we right-click on Dimension/Measure and look for “Default Properties”, both Dimension and Measure share Color & Comment.
For Dimensions, Number Format will only be there for Date type fields.
Colors: Dimension vs Measure
The colors are from Default Properties. Don’t confuse it with Blue or Green!
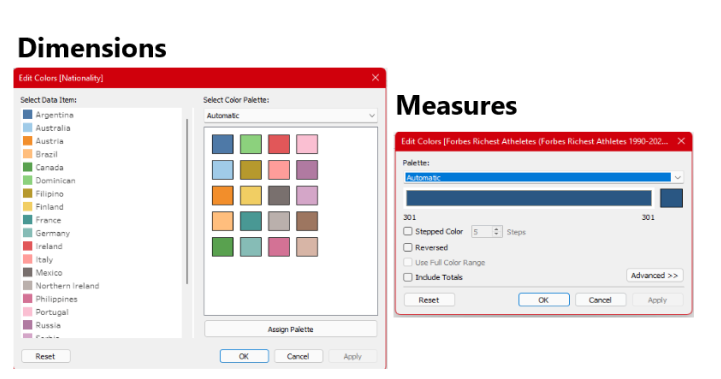
When we choose Color>>Default Properties for Dimension, it gives an option for a distinct color palette. But if we do the same for Measure, it will provide a sequential color palette.
Discrete vs Continuous
Discrete in Tableau stands for any data that is individual. It is represented by blue pills. These are used to create headers in our charts.
Continuous in Tableau stands for any data that is in chain format i.e. forming an unbroken whole, without interruption. This type of data is represented by green pills. These assist in creating an axis.

Discrete + Continuous : HOW?
Discrete and Continuous helps to understand how we want to display our data?
Filters: Discrete vs Continuous
When we try to use Discrete fields as filters. We get four options: General, Wildcard, Condition, Top
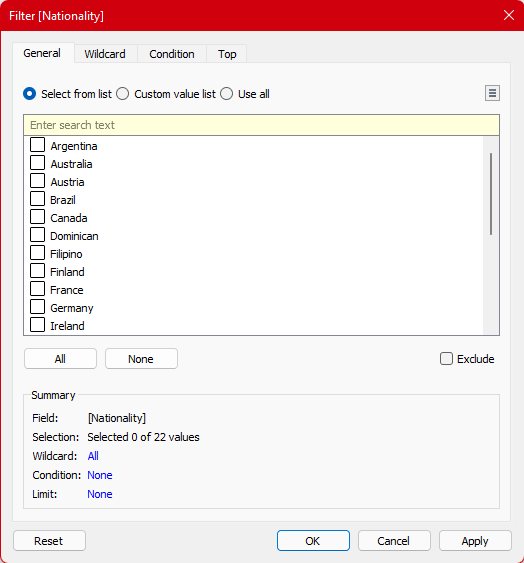
But, if we use Continuous fields as filters, it shows different options.

Putting it all together!
Dimension + Measure: WHAT?
Discrete(Blue) + Continuous(Green): HOW?

Now, since we understood the core meaning of Dimension, Measure, Discrete, Continuous. It’s time to combine them and put them in a real project.
A Dimension could be both Discrete or Continuous. But it is usually Discrete.
A Measure could be both Discrete or Continuous. But it is usually Continuous.
That means a Dimension is capable of producing either an axis or a header. Similarly, a Measure is also capable of producing either an axis or a header.
Geographic and Date can be Continuous as well as Discrete.
Dimensions containing strings or Boolean values cannot be continuous.
Converting a Dimension to Measure and Vice-Versa
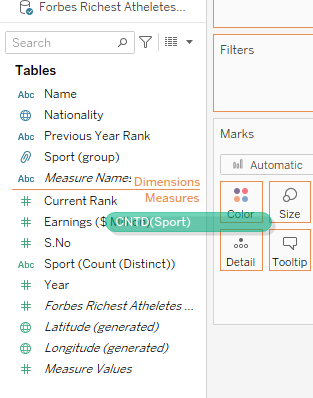
To use a data field as Dimension or Measure, simply drag and drop it before or after the separating line.
Converting from Discrete to Continuous and Vice-Versa
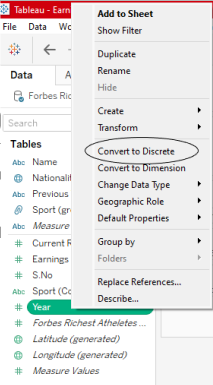
Discrete Field can be converted to Continuous and vice-versa, by just right-clicking and choosing the desired option.
Dimensions in the View
The usual case → When we try to put discrete dimensions in the view, it creates a header.

The unusual case → But, if we try to put a continuous dimension in the view, Tableau will try to aggregate that dimension and will create a continuous axis.

Measures in the View
The usual case → When we try to put continuous Measures in the view, it creates an axis.

The unusual case → But, if we convert the continuous measure to discrete measure, it will give us a header.
This case can be useful when we want to create just headers or labels.

Measure Values & Measure Names
Whenever you’ll load the data in Tableau, you’ll always notice Measure Names & Measure Values in the data pane. These values are automatically generated by Tableau and can’t be deleted.
Measured values are continuous measure, that contains all the measures in the data.
Measure name is a discrete dimension, that contains the name of all the measures.
Measure Names & Measure Values acts similar to other Discrete Dimension & Continuous Measures respectively.
We can add Measure Names & Measure Values together when we want to create text tables that show multiple measures.
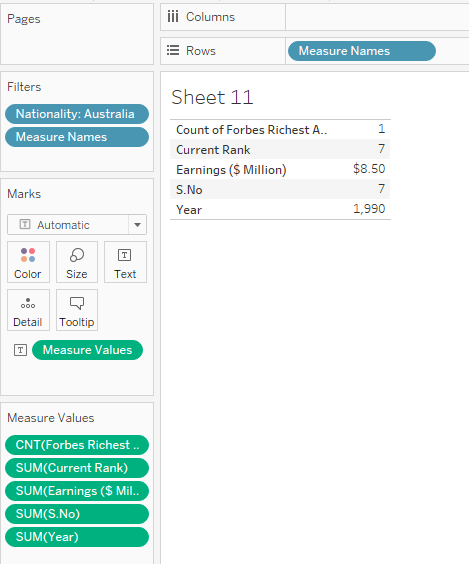
In this example, if for the country “Australia” we want to know everything in form of text tables, rather than dragging and dropping each measure, we could use measure values.
Tableau will automatically add Measure Names & Measure Values in the view if we are dealing with charts involving multiple axes i.e. Adding two or more measures to the same axis automatically adds Measure Names and usually Measure Values to a view.
Text-tables can create max 50 rows & 16 columns.
Sample Exam Questions from this Topic
Tableau automatically generates __ dimensions and __ measures.
a. 2,4
b. 1,4
c. 4,1
d. 4,2
Solution: 1,4
We can apply aggregations on ___
a. Green fields
b. Blue fields
c. Discrete
d. Continuous
Solution: Green fields
What are common default properties for both Dimension and Measures? [Choose 2]
a. Comment
b. Color
c. Shape
d. Total Using
Solution: Comment, Color
Measure value is ____.
a. Discrete Dimension
b. Continuous Dimension
c. Discrete Measure
d. Continuous Measure
Solution: Continuous Measure
Dimension containing __ or ___ can’t be continuous?
a. String
b. Boolean
c. Geographic
d. Dates
Solution: String, Boolean
Use the link to get access to free Tableau certification dumps (Valid till 6 July 2022):
References:
[1] Tableau Help U+007C Tableau Software
[2] Personal Notes
[3]Tableau Desktop Specialist Exam (New Pattern — 2021) — Apisero
[4] sqlbelle
Thanks for Reading!
Feel free to give claps so I know how helpful this post was for you, and share it on your social networks, this would be very helpful for me.
If you like this article and want to learn more about Machine Learning, Data Science, Python, BI. Please consider subscribing to my newsletter:
Find me on the Web: www.dakshtrehan.com
Connect with me at LinkedIn: www.linkedin.com/in/dakshtrehan
Read my Tech blogs: www.dakshtrehan.medium.com
Connect with me at Instagram: www.instagram.com/_daksh_trehan_
Want to learn more?
Tableau from Scratch (List of Tableau Articles)
Machine Learning from Scratch (List of ML Articles)
How is YouTube using AI to recommend videos?
Detecting COVID-19 Using Deep Learning
The Inescapable AI Algorithm: TikTok
GPT-3 Explained to a 5-year old.
Tinder+AI: A perfect Matchmaking?
An insider’s guide to Cartoonization using Machine Learning
How Google made “Hum to Search?”
One-line Magical code to perform EDA!
Give me 5-minutes, I’ll give you a DeepFake!
Cheers
Join thousands of data leaders on the AI newsletter. Join over 80,000 subscribers and keep up to date with the latest developments in AI. From research to projects and ideas. If you are building an AI startup, an AI-related product, or a service, we invite you to consider becoming a sponsor.
Published via Towards AI
Take our 90+ lesson From Beginner to Advanced LLM Developer Certification: From choosing a project to deploying a working product this is the most comprehensive and practical LLM course out there!
Towards AI has published Building LLMs for Production—our 470+ page guide to mastering LLMs with practical projects and expert insights!

Discover Your Dream AI Career at Towards AI Jobs
Towards AI has built a jobs board tailored specifically to Machine Learning and Data Science Jobs and Skills. Our software searches for live AI jobs each hour, labels and categorises them and makes them easily searchable. Explore over 40,000 live jobs today with Towards AI Jobs!
Note: Content contains the views of the contributing authors and not Towards AI.


