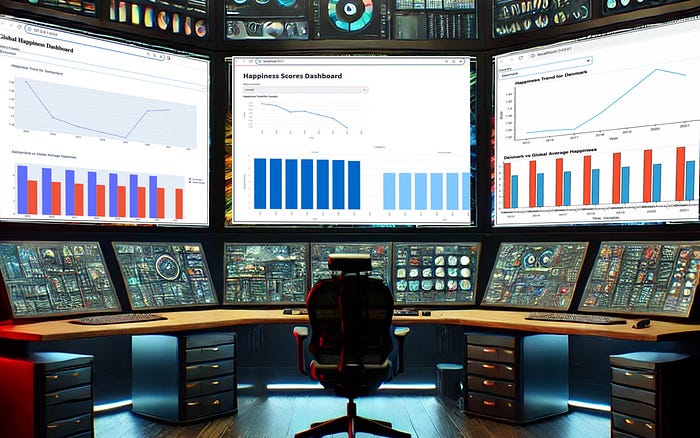
Which Python Dashboard Is Better? Dash, Panel And Streamlit Showdown
Author(s): John Loewen, PhD
Originally published on Towards AI.
Prompting GPT-4 for multi-visual interactive dashboard creation
This member-only story is on us. Upgrade to access all of Medium.
As a comp sci professor, over the past year, I have heavily integrated GPT-4o into my data visual creation workflow.
Recently I have noticed that GPT-4 has improved in leaps and bounds with its ability to create Python code for multi-visual dashboards.
Has it also improved its skill in providing seamless dashboard creation for other Python dashboard libraries? Like Panel and Streamlit?
Let’s have a showdown and find out!
For this exercise, I will be using the downloaded file (saved as “happiness_years02.csv”), which includes data on global happiness metrics by country over several years (2015–2022).
It can be downloaded HERE.
To start with, we want to load the dataset with pandas, focusing on each country and the happiness score by year (2015–2022). To crystalize the view for GPT-4, we can ask GPT-4 to look at the dataset and tell us what it sees.
We can click the attachment icon in the GPT-4 main window and upload our dataset, then prompt GPT-4 for analysis:
This way, we can clarify any anomalies that may exist between GPT-4’s interpretation of the data vs. our interpretation.
GPT-4 Response:
Yep, this looks completely right. We’re using a very simple dataset for the sake of… Read the full blog for free on Medium.
Join thousands of data leaders on the AI newsletter. Join over 80,000 subscribers and keep up to date with the latest developments in AI. From research to projects and ideas. If you are building an AI startup, an AI-related product, or a service, we invite you to consider becoming a sponsor.
Published via Towards AI
Take our 90+ lesson From Beginner to Advanced LLM Developer Certification: From choosing a project to deploying a working product this is the most comprehensive and practical LLM course out there!
Towards AI has published Building LLMs for Production—our 470+ page guide to mastering LLMs with practical projects and expert insights!

Discover Your Dream AI Career at Towards AI Jobs
Towards AI has built a jobs board tailored specifically to Machine Learning and Data Science Jobs and Skills. Our software searches for live AI jobs each hour, labels and categorises them and makes them easily searchable. Explore over 40,000 live jobs today with Towards AI Jobs!
Note: Content contains the views of the contributing authors and not Towards AI.


