How To Avoid Common Pitfalls in Time Series Forecasting
Author(s): Jonte Dancker
Originally published on Towards AI.

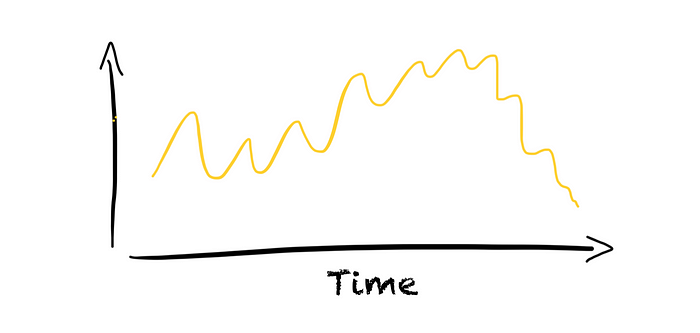
Time series data is everywhere and is one of the most available data. Many industries, including retail, financing, or energy, use time series.
In time series, observations are recorded at regular or irregular time intervals. Hence, observations are time-dependent and we can order them based on time. Time series data is also often called structured or tabular data.
Time series are often used to forecast future behavior to support decision-making. For example, a retailer wants to predict how much stock they need to cover demand. An energy company wants to predict the energy generation of wind or solar power parks. For this, businesses usually use past observations and some exogenous variables.
However, forecasting time series is usually more difficult compared to other ML tasks. This is because many time series contain different non-stationarities and/or non-normalities. If we do not address these characteristics our forecast model might fail to produce good forecasts. Hence, it is important to know what non-stationarities and non-normalities can appear in time series and how to deal with them.
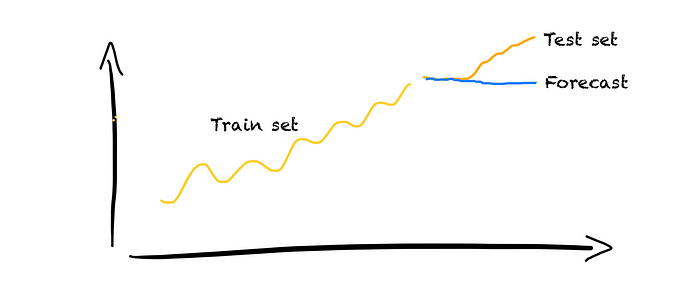
In this article, I will first describe the characteristics of the time series you need to know. Then, I will give you some tools to handle these characteristics. This will help you avoid common pitfalls in time series forecasting and make your forecasts better.
Non-stationarities
Non-stationarity means that the distribution of observations changes over time. For example, the mean or variance of the distribution can change.
Common non-stationarities are trend, seasonality, cycles, heteroscedasticity, and structural breaks.
Trend
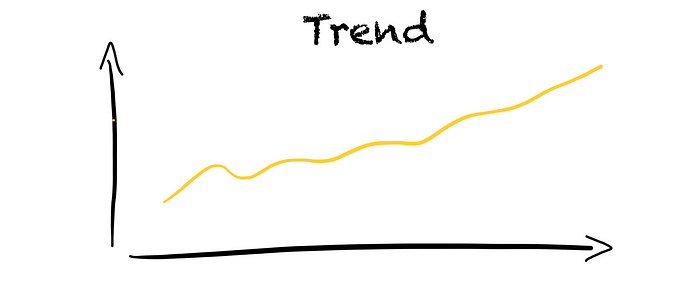
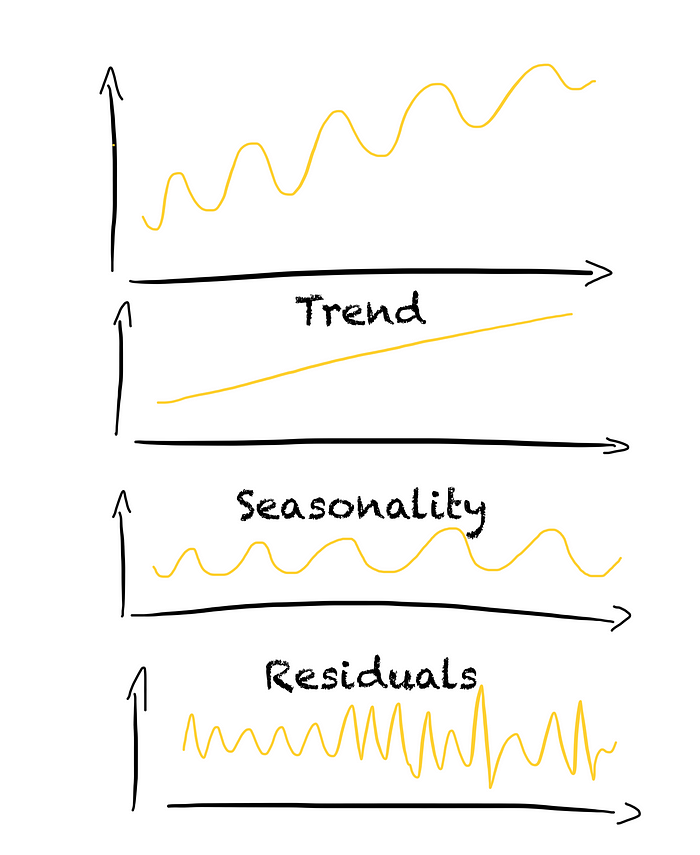
A trend shows the general direction of the time series over a long period. The trend refers to the long-term change in the mean and is the slowest-moving part of a time series.
To identify if a trend exists, we can use a moving average with a wide window.
Seasonality
Seasonality describes repetitive and periodic changes in the mean of the time series. These changes can occur within days, weeks, or months. These changes usually show temporal effects, such as annual temperature fluctuations.

To identify if a seasonality exists, we can use several approaches, such as
- autocorrelation plot
- partial autocorrelation plot
- lag/seasonal plot
- Fourier features
Cycle
Cycles are similar to seasonality as they are a repetition of a certain behavior. However, the changes do not occur in a fixed period and thus have an uncertain structure.
This uncertainty makes it difficult to identify if cycles exist. One approach is to use lagging on the de-trended and de-seasonalized time series.

Heteroscedasticity
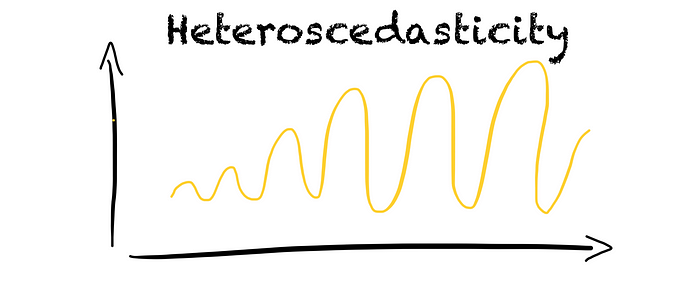
With heteroscedasticity, we describe a changing variance over time. Heteroscedasticity comes hand-in-hand with an increasing trend.
Structural breaks
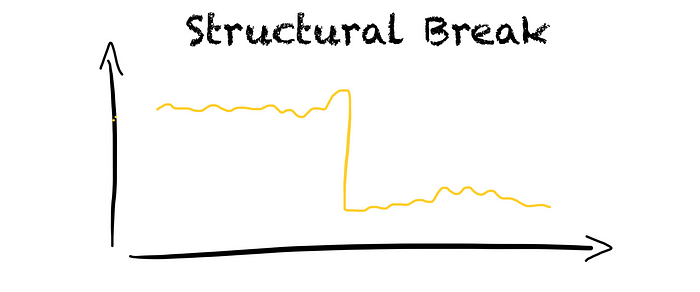
Structural breaks occur when there is a sudden change in the data distribution. For example, a large power plant goes offline leading to a drop in electricity generation.
Non-normalities
Non-normality describes non-symmetric distributions that are a result of outliers or intermittency.
Outliers
Outliers are rare events that deviate significantly from other observations. Outliers can indicate errors in the data collection process, such as a malfunction of a sensor. But, outliers can also be of specific interest such as in fraud detection.

What values are outliers often depends on the context. For example, in winter 0°C is an expected temperature while in summer the same temperature is probably an outlier.
In time series, outliers are challenging due to the temporal dependency between observations.
Intermittency
Intermittency means that the time series does not have a non-zero value for every point in our time grid.

Intermittency can occur for two reasons. First, the time series is captured at irregular intervals and is brought onto a regular-spaced time grid. For example, natural disasters such as earthquakes or volcanic eruptions. Second, not all points in time have a non-zero observation. For example, a product might not be sold every hour or day.
Handling non-stationarities and non-normalities
After we have identified non-stationarities and non-normalities, we need to remove them. The goal is to make the time series stationary and the values being normally distributed.
But there is no one rule-fits-all solution. We need to choose the approaches depending on which characteristics appear.
A time series is stationary when its statistical properties, such as mean, variance, and covariance, stay constant over time.

Stationarity is important as
- stationary time series are more predictable, leading to easier and more reliable forecasts
- many forecasting methods assume stationarity of the time series, such as ARMA models
To make a time series stationary, we mainly need to focus on the trend, seasonality, and heteroscedasticity. These can be removed by
- differencing (once or more)
- decomposing the time series into its components, e.g., STL decomposition
- subtracting the moving average
- using transformations to remove heteroscedasticity (e.g., Power Transformations, such as Box-Cox or Yeo-Johnson, or log transformations)
- or a combination of the above
To remove the trend using differencing, we can take the difference between the current and previous observation. To remove seasonality, we can take the difference between the current observation and the observation of the past season.
When decomposing the time series, the components can be additive or multiplicative. In an additive decomposition, the seasonality and residuals are independent of the trend. In contrast, in a multiplicative decomposition, the seasonality and residuals depend on the trend.
To make a time series normally distributed we can
- use transformations such as power or log transformation
- remove/replace outliers
Conclusion
In this article, I have shown you how you can avoid common pitfalls in time series forecasting. I have shown you what characteristics can appear in time series and how you can deal with them.
Join thousands of data leaders on the AI newsletter. Join over 80,000 subscribers and keep up to date with the latest developments in AI. From research to projects and ideas. If you are building an AI startup, an AI-related product, or a service, we invite you to consider becoming a sponsor.
Published via Towards AI
Take our 90+ lesson From Beginner to Advanced LLM Developer Certification: From choosing a project to deploying a working product this is the most comprehensive and practical LLM course out there!
Towards AI has published Building LLMs for Production—our 470+ page guide to mastering LLMs with practical projects and expert insights!

Discover Your Dream AI Career at Towards AI Jobs
Towards AI has built a jobs board tailored specifically to Machine Learning and Data Science Jobs and Skills. Our software searches for live AI jobs each hour, labels and categorises them and makes them easily searchable. Explore over 40,000 live jobs today with Towards AI Jobs!
Note: Content contains the views of the contributing authors and not Towards AI.


