Using Vega-Lite for Data Visualization
Last Updated on December 21, 2023 by Editorial Team
Author(s): Angelica Lo Duca
Originally published on Towards AI.
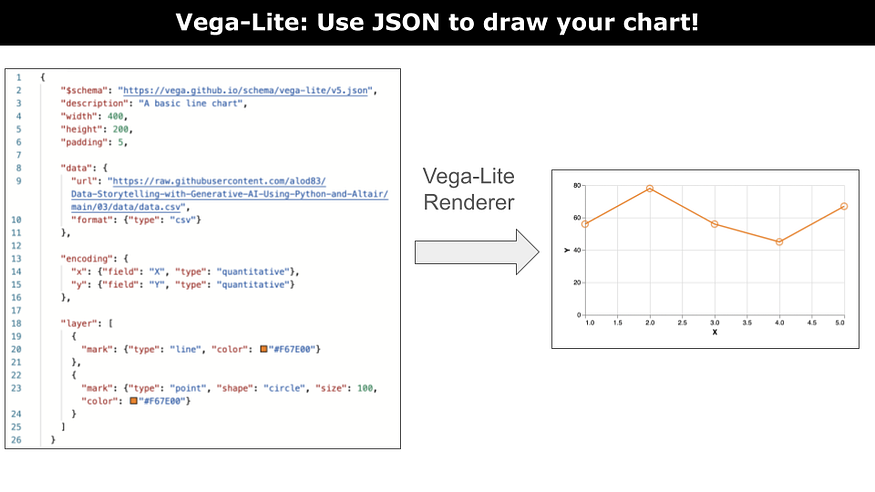
A tutorial on how to start using Vega-Lite to draw charts.
Image by Author
Vega-lite is a concise JSON representation of a Vega visualization. Vega is a visualization grammar used to represent the elements of a data visualization chart. For those who know D3.js, you can imagine the output produced by D3.js as very close to that produced by Vega. For those who are not familiar with D3.js, you can think of Vega as a description in JSON of your chart, including axes, scales, types of marks, and so on.
Since Vega is a grammar, its syntax is quite verbose, so the developers have thought to compact the syntax to make it shorter. And here is Vega-Lite.
The basic sections of a Vega-lite JSON specification are:
MetadataDataEncoding,MarkLayer.
Let’s investigate each separately.
Start by defining the Vega-Lite version you want to use (identified by the keyword $schema), a description of the chart, its size (width and height), and the padding used in the chart. The following code shows the initial configuration:
{ "$schema": "https://vega.github.io/schema/vega-lite/v5.json", "description": "A basic line chart", "width": 400, "height": 200, "padding": 5,}
This section specifies the data source for the visualization, as shown in the following snippet of code:
"data": { "url": "https://raw.githubusercontent.com/alod83/Data-Storytelling-with-Generative-AI-Using-Python-and-Altair/main/03/data/data.csv", "format": {"type": "csv"} },
The example loads a CSV file from a URL. However,… Read the full blog for free on Medium.
Join thousands of data leaders on the AI newsletter. Join over 80,000 subscribers and keep up to date with the latest developments in AI. From research to projects and ideas. If you are building an AI startup, an AI-related product, or a service, we invite you to consider becoming a sponsor.
Published via Towards AI
Take our 90+ lesson From Beginner to Advanced LLM Developer Certification: From choosing a project to deploying a working product this is the most comprehensive and practical LLM course out there!
Towards AI has published Building LLMs for Production—our 470+ page guide to mastering LLMs with practical projects and expert insights!

Discover Your Dream AI Career at Towards AI Jobs
Towards AI has built a jobs board tailored specifically to Machine Learning and Data Science Jobs and Skills. Our software searches for live AI jobs each hour, labels and categorises them and makes them easily searchable. Explore over 40,000 live jobs today with Towards AI Jobs!
Note: Content contains the views of the contributing authors and not Towards AI.


