How I Used the Strava API, and Tableau To Prepare a Trail Run Competition
Last Updated on July 25, 2023 by Editorial Team
Author(s): Edoardo Bianchi
Originally published on Towards AI.
A data-driven approach to visualize progress and improve performance over time

This member-only story is on us. Upgrade to access all of Medium.
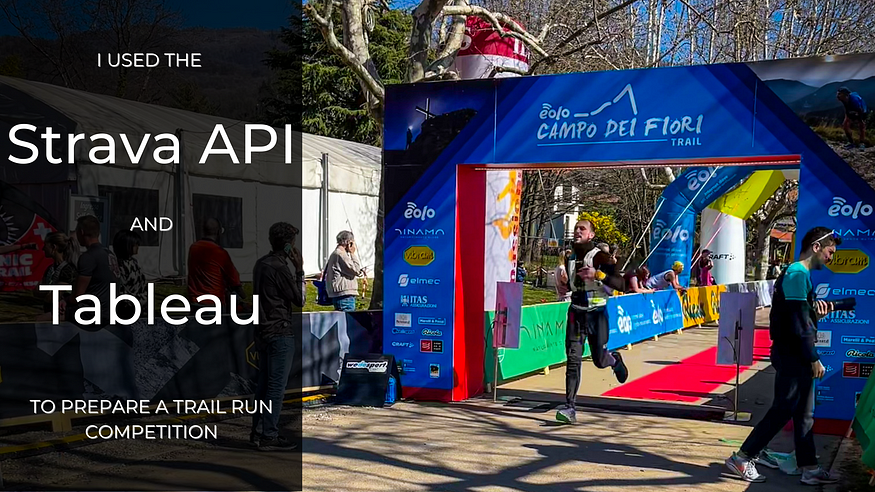
Me crossing the finish line. Image by the author.
Four months ago, I decided to join a trail running competition that takes place every year in my hometown. I have always been an active person, but I have never run in the mountains or competed. To better prepare, I decided to put into action some of my data science skills. In particular, I used the Strava API to retrieve my activities, and then I created a dashboard with Tableau that summarized my training progress. In this article, I will show… Read the full blog for free on Medium.
Join thousands of data leaders on the AI newsletter. Join over 80,000 subscribers and keep up to date with the latest developments in AI. From research to projects and ideas. If you are building an AI startup, an AI-related product, or a service, we invite you to consider becoming a sponsor.
Published via Towards AI
Take our 90+ lesson From Beginner to Advanced LLM Developer Certification: From choosing a project to deploying a working product this is the most comprehensive and practical LLM course out there!
Towards AI has published Building LLMs for Production—our 470+ page guide to mastering LLMs with practical projects and expert insights!

Discover Your Dream AI Career at Towards AI Jobs
Towards AI has built a jobs board tailored specifically to Machine Learning and Data Science Jobs and Skills. Our software searches for live AI jobs each hour, labels and categorises them and makes them easily searchable. Explore over 40,000 live jobs today with Towards AI Jobs!
Note: Content contains the views of the contributing authors and not Towards AI.


